Introduction
1.1 Ugandan Nutrition Action Plan
The global Scaling Up Nutrition (SUN) Movement calls for action and investment to improve maternal and child nutrition. The Government of Uganda (GoU) has committed itself to the SUN principles, a commitment that culminated in the development of the Uganda Nutrition Action Plan (UNAP), 2011-2016. The UNAP outlines GoU’s dedication to fulfilling its obligation of ensuring food and nutrition security for all Ugandans, especially those living in areas reported to have the highest levels of malnutrition. UNAP was launched in November 2011 and is coordinated by the Office of the Prime Minister (OPM).
The ultimate goal of the UNAP is to reduce levels of malnutrition among women of reproductive age, infants, and young children through 2016. Ensuring that all Ugandans are properly nourished will enable them live healthy and productive lives. To achieve this goal and to improve the nutrition status indicators, the UNAP has five strategic objectives that will be pursued through 2016. Under these five objectives, the UNAP has 13 strategic areas, as shown in Table 1.1.
Table 1.1. UNAP Objectives and Strategic Areas
| Objective 1: Improve access to and utilization of services related to maternal, infant, and young child nutrition. | Strategy 1.1: Promote access to and utilization of nutrition and health services to all women of reproductive age, infants, and young children. |
| Strategy 1.2: Address gender and socio-cultural issues that affect maternal, infant, and young child nutrition. | |
| Objective 2: Enhance consumption of diverse diets. | Strategy 2.1: Increase access to and use of diverse nutritious foods at the household level. |
| Strategy 2.2: Increase post-harvest handling, storage, and utilization of nutritious food at the household and farm levels | |
| Strategy 2.3: Promote the consumption of nutrient-enhanced foods. | |
| Objective 3: Protect households from the impact of shocks and other vulnerabilities that affect their nutritional status. | Strategy 3.1: Develop preparedness plans for shocks. |
| Strategy 3.2: Promote social protection interventions for improved nutrition | |
| Objective 4: Strengthen the policy, legal, and institutional frameworks and the capacity to effectively plan, implement, monitor, and evaluate nutrition programs. | Strategy 4.1: Strengthen the policy and legal frameworks for coordinating, planning, and monitoring nutrition activities. |
| Strategy 4.2: Strengthen and harmonize the institutional framework for nutrition from the local to the central government level. | |
| Strategy 4.3: Strengthen human resource capacity to plan, implement, monitor, and evaluate food and nutrition programs in the country. | |
| Strategy 4.4: Enhance operational research for nutrition | |
| Objective 5: Create awareness of and maintain national interest in and commitment to improving and supporting nutrition programs in the country. | Strategy 5.1: Increase awareness of and commitment to addressing nutrition issues in the country. |
| Strategy 5.2: Advocate for increased commitment to improving nutrition outcomes. |
1.2 The “Pathways to Better Nutrition” Case Study
With support from SPRING, Deutshe Stiftung Weltbevoloelkerung (DSW) prepared this district budget analysis for the “Pathways to Better Nutrition” (PBN) case study to generate evidence on government investments to effectively implement planned activities under the UNAP at the district level. The PBN case study explores whether the GoU and its development partners are making the necessary financial investments to enable the roll out of UNAP activities in two selected districts – Lira and Kisoro.
The key domains of inquiry of the PBN study are—:
- Learning, adaptation, and evidence on scale-up
- Adaptation of innovations/interventions to context(s)
- Financing of nutrition activities
- Long-term planning for sustainability
The PBN case study’s overall objectives are to explore the relative emphasis given to the nutrition-specific and nutrition-sensitive activities and how prioritization of these activities affects the financial resources allocated. The district budget analysis presented here supports the creation of evidence around the last two domains. For this work, DSW defined several district-level objectives:
- Document government nutrition activities at the district government level using UNAP as a benchmark.
- Analyze how the local government (LG) prioritizes nutrition interventions and supports the implementation of the UNAP to reach its chosen goals of reducing undernutrition.
- Analyze whether the LGs and their development partners make the necessary investments to implement the UNAP activities.
This district budget analysis (largely quantitative) is complemented by qualitative analysis, which focused more on the first two study domains.
1.3 Methodology
DSW followed the overall SPRING PBN study protocol. The study was done using a ‘q-squared’ methodology, which means the analysis of quantitative trends and patterns was complimented with a qualitative understanding of the underlying budget allocations. This allowed the research team to validate and triangulate the quantitative findings with input from district officials. In this way, the quantitative budget analysis was integrated with qualitative work that focused on identifying nutrition-sensitive and -specific allocation by district officials.
Box 1. Basic Definitions
Nutrition-specific interventions: target the immediate causes of undernutrition: inadequate dietary intake and ill health.
Nutrition-sensitive interventions: Unlike nutrition-specific interventions, nutrition-sensitive interventions lack a common definition. Nutrition-sensitive interventions seek to promote adequate nutrition as the goal of national development policies in agriculture, food security, social protection, health, and education programs. These interventions aim to address poverty, gender inequality, food insecurity, and/or lack of access to education, health, clean water, and other basic services.
The analysis of nutrition budget allocations was based on the UNAP, which has five objective areas (see table 1.1), four sectors (education; health; agriculture; gender, labor, and social development community-based services) and water. Although the UNAP does not explicitly include water, under UNAP strategy 1.1, there is an emphasis on the promotion of proper food-handling hygiene, and sanitation through increased knowledge, use of safe water, and handwashing practices at the household level. Additionally, promotion of safe water is the water sector’s mandate. It is for these reasons that this analysis includes the water sector.
Within the sectors named by UNAP and water, only some activities are considered nutrition-specific or nutrition–sensitive (see box 1). Even among these activities, some may be integrated so that only a percentage of the funds are allocated to nutrition activities (for instance, a budget item for antenatal care provision is only partially related to nutrition).
The following steps were taken to identify, validate, and analyze nutrition-related allocation:
- DSW teams obtained copies of the district and Lira Regional Referral Hospital (LRH) work plans and budgets from the financial years 2012/13 and 2014/15. Other agencies (National Medical Stores [NMS] and nongovernmental organizations [NGOs]), provided only their budget and spending information.
- A data extraction tool was developed in an Excel spreadsheet to help capture information from all sources.
- Information was entered into the Excel tool format. For the district and LRH, the tool captured information on all budget lines for each of the five sectors.
- The first draft of the completed tool was shared in advance with district officials from the five key sectors, LRH, donors, and NGO officials in the two districts to review and verify the information.
- The DSW team had in-person meetings with the heads of sectors in the two districts and the administrator of LRH. During the interactions, the heads of sectors, including other staff, identified nutrition-relevant activities in their sector budgets, substantiated their activities by providing examples, related the budget line to UNAP strategic areas, and estimated how much of the allocation was for nutrition.
- The DSW team compiled the responses and developed the methodology to translate them into percentages. The percentages were allocated as follows:1
- No activity – 0 percent
- Little activity – 10 percent
- Moderate – 50 percent
- Many activities – 70 percent
- Most of the activities – 80 percent
- All activities – 100 percent
- Using the percentages allocated for each budget line, the DSW team aggregated the amounts to generate the total amount for the sector. Then, the team aggregated the amounts for the five sectors to generate the total amount for the district.
- After review and triangulation, data were analyzed in Excel to generate the information that allowed for the writing of this report.
It should be noted that while the percentages are only estimates, the data generated provides an indication of how much districts and other agencies spend on nutrition-related activities.
The full methodology for budget analysis at the national and district levels in Uganda can be accessed at: https://www.spring-nutrition.org/publications/briefs/annex-spring-pathways-better-nutrition-budget-methods-uganda.
1.4 Scope
The study was carried out in Lira and Kisoro districts and covered two financial years: 2013/14 and 2014/15. Details on the Kisoro study are available in a sister report by SPRING, “Pathways to Better Nutrition Case Study Evidence Series – Uganda: Report on Nutrition Financing in Kisoro District– 2013/2014 and 2014/15 Financial Years.”
To be selected, districts needed to meet at least one of the following criteria:
- be an early adopter of the UNAP district and sub-district committee structures
- participate in Community Connector
These criteria are related to the district’s relative progress in rolling out the UNAP and the availability of district-representative secondary quantitative data to complement SPRING’s case study findings.
SPRING also considered geographic location and region to increase diversity of context, following the “most different” methodology used to select country cases. Finally, to avoid the appearance of self-evaluation, only one of the two districts selected also contains SPRING implementation activities.
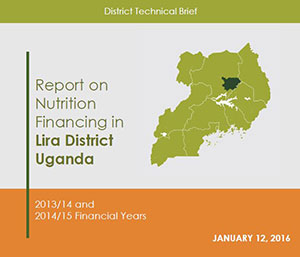
Lira District is located in Lango sub-region in Northern Uganda and is bordered by the districts of Pader and Otuke in the North and North East, Alebtong in the East, Dokolo in the South and Apac in the West. The total land area of Lira district is 7,200.7 square kilometers. Lira district is made of 9 subcounties and 4 divisions; 63 parishes and 20 wards; 678 villages and 64 cells. The district population is estimated to be 410,516 people (UBOS, 2014). The economy of the district is mainly based on agriculture, with 81 percent of the population engaged in subsistence farming. Other sectors in the economy include agro processing industries (3.1 percent), commercial activities and banking (15.9 percent).
Nutritional data on Lira is somewhat difficult to obtain. A 2008 Action Against Hunger (ACF) nutrition survey covering only northern Lira, where there is a concentration of internally displaced persons (IDP) camps, estimated acute malnutrition using SMART survey methods. The survey found that there was 4.6 percent global acute malnutrition2 (wasting) (ACF 2008). No estimates of stunting or anemia are available. The 2008 Food Consumption Survey estimated intake for the populations in Lira and Kitgum Districts combined; from this study they found that children 6-59 months averaged about 1,215 calories per day, while women of reproductive age received on average 2,074 calories (Harvey, Zo Rambeloson, and Omar Dary, 2010). These averages are both lower than the other areas surveyed in Uganda as found by the last national consumption survey (Nakabo-Ssewanyana and Kasirye, 2010).
1.5 Challenges
There is an inherent difficulty in parsing out nutrition financing since it does not have its own sector or line items within sector budgets. As such, the results are from approximations of nutrition funding. Limitations included—
- In the sector work plans and budgets, wages are centralized in the administration budget and not captured in the respective sector budgets. Thus, we were not able to capture wages in the total sector allocation.
- The Output Budgeting Tool (OBT) the districts used to prepare their budgets is very restrictive, and makes it difficult to capture activities in detail for each budget line. It is thus difficult to disaggregate nutrition-related allocation.
- There are several NGOs implementing nutrition-related projects at the district level, and some were reluctant to provide information on their projects. Those who did provided it in aggregate format, making analysis for each financial year very difficult. In addition, most NGOs were not able to provide information for FY 2014/15.
- Despite National Medical Stores (NMS) willingness to provide data on nutrition spending they were unable to provide data for FY 2014/15.
1.6 Structure of the Report
Findings in this report are divided into seven sections. Section 2.1 looks at the overall budget for Lira district. Section 2.2 looks at nutrition budget allocations within the district government. Sections 2.3 – 2.5 look at budget allocations within LRH, Medical Supplies, and external funding from NGOs and development partners, respectively. Section 2.6 provides the overall nutrition allocation for Lira, and section 2.7 includes additional observations. Finally, section 3 provides a summary of findings, conclusions, and recommendations.
Findings
2.1 Overall Budget
Sources of revenue
There are three major revenue sources for district: local revenues, central government (CG) transfers, and donor on-budget funding. All other donor funding is considered off-budget, or run outside the government system. In nominal terms the district projected revenue was Shs 29.1 billion and Shs 32.4 billion for FY 2013/14 and FY 2014/15 respectively (see figure 2.1). Since it is a requirement that the district budget has to balance (revenue must equal expenditure), revenue performance has a direct impact on spending.
Figure 2.1. Lira District Revenue Sources
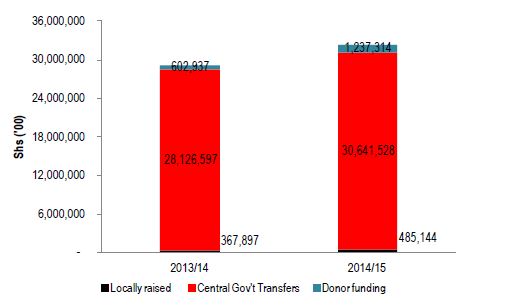
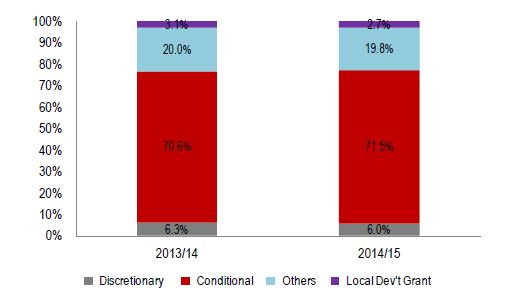
As is the case with all District Local Governments (DLGs) in Uganda, Lira district largely depends on CG transfers. The CG transfers to Lira district were 97 percent and 95 percent of the total revenues for FY 2013/14 and FY 2014/15 respectively. It should be noted that the largest proportion of CG transfers are conditional in nature (see figure 2.2) because of their bias towards the National Priority Program Areas (NPPA)3, which are dictated through the Indicative Planning Figures (IPFs). This severely limits the ability of LGs to allocate funds as they may wish. If no other discretionary funds are given to the districts to support the UNAP rollout, then the districts will have little control over allocation of funds for nutrition-related spending.
Figure 2.2. Composition of CG Transfers to Lira District
Budget Allocation
The district budget is allocated to 12 sectors, which include: Administration, Community Based Services, Education, Finance, Health, Internal Audit, Natural Resources, Planning, Production (agriculture) and Marketing, Roads & Engineering, Statutory Bodies, and Water.
The education sector took over half of the total district allocation: 45.4 percent in 2013/14 and 50.3 percent in 2014/15. The share of allocation to the other three sectors (named in the UNAP) and water was 23.8 percent in 2013/14 and 18.6 percent in 2014/15 (see table 2.1).
Table 2.1. Lira District Budget Allocations
| Sector | 2013/14 | 2014/15 | ||
|---|---|---|---|---|
| Amount (‘000) | Share | Amount (‘000) | Share | |
| Education | 13,207,716 | 45.4% | 16,291,557 | 50.3% |
| Administration | 5,607,588 | 19.3% | 5,857,430 | 18.1% |
| Health | 3,473,822 | 11.9% | 3,367,009 | 10.4% |
| Production | 2,184,972 | 7.5% | 1,191,321 | 3.7% |
| Finance | 1,202,438 | 4.1% | 250,727 | 0.8% |
| Roads & Engineering | 1,156,602 | 4.0% | 1,911,894 | 5.9% |
| Water | 1,012,056 | 3.5% | 1,160,001 | 3.6% |
| Statutory Bodies | 749,784 | 2.6% | 784,394 | 2.4% |
| Community Based Services | 240,441 | 0.8% | 309,020 | 1.0% |
| Natural Resources | 122,566 | 0.4% | 220,760 | 0.7% |
| Planning | 107,791 | 0.4% | 951,004 | 2.9% |
| Internal Audit | 31,655 | 0.1% | 68,869 | 0.2% |
| Total | 29,097,431 | 100% | 32,363,986 | 100% |
Source: Author’s calculation based on Lira District Budget Estimates
A further analysis of allocation on the four sectors (named in the UNAP) and water shows a larger amount of the allocation is recurrent in nature (wage and non-wage). Recurrent allocations were 77 percent and 84 percent in 2013/14 and 2014/15 respectively (see figure 2.3). The higher share of recurrent allocation is attributed to the high wage component in the education and health sectors. It should be noted that recurrent spending is non-fungible, so little of the district funds can be re-prioritized.
Figure 2.3. Lira Composition of the UNAP & Water Sector Allocation
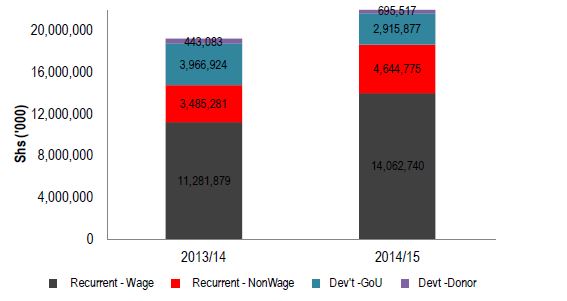
It should be noted that all donor funding is categorized as part of the development budget, which increases the proportion of development spending. However, development spending is not just for capital spending (e.g., building new facilities, repairs to existing physical assets). The development spending is heavily oriented toward non-wage recurrent expenditures (such as buying vehicles, paying allowances) rather than capital expenditures. The low level of capital spending has negative implications on infrastructure development, which is critical to provision and sustainability of nutrition interventions.
2.2 Nutrition (Specific and Sensitive) Budget Allocations
2.2.1 Lira District Budget Allocation
The total Lira nutrition (specific and sensitive) budget allocation for the four sectors (named in the UNAP) and water was Shs 1.38 billion in FY 2013/14 and Shs 1.2 billion in FY 2014/15 (see table 2.2 and figure 2.4). The share of nutrition related budget allocation to the total allocation to the five sectors is estimated at 7.7 percent in 2013/14 and 5.0 percent in 2014/15. Contrary to the belief that nutrition spending is mainly in health, there is high nutrition-sensitive allocation in production (agriculture), especially on food production. The production sector has the highest share (on average during the last two FYs) of nutrition-related allocations of 21.2 percent, this is followed by health at 12 percent, water and community-based services at 10 percent each, and education at 2.6 percent.
Figure 2.4. Total Lira District Budget Allocations
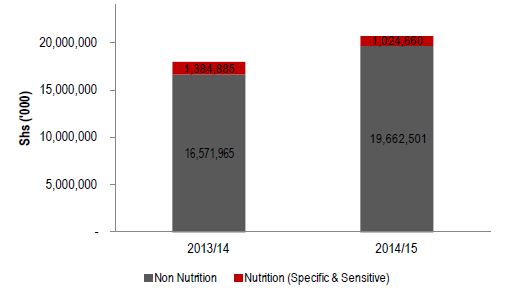
Table 2.2. Lira Total Nutrition (Specific & Sensitive) Budgetary Allocations (Figures in Shs ‘000)
| Sector | 2013/14 | 2014/15 | ||||
|---|---|---|---|---|---|---|
| Total | Nutrition (Specific & Sensitive) | Share | Total | Nutrition (Specific & Sensitive) | Share | |
| Health | 3,356,899 | 402,422 | 12.0% | 3,179,795 | 384,712 | 12.1% |
| Production | 1,837,930 | 594,671 | 32.4% | 1,096,190 | 109,619 | 10.0% |
| Education | 11,933,403 | 304,930 | 2.6% | 15,201,905 | 409,403 | 2.7% |
| Water | 755,049 | 75,505 | 10.0% | 1,053,453 | 105,345 | 10.0% |
| Community-Based Services | 73,569 | 7,357 | 10.0% | 155,818 | 15,582 | 10.0% |
| Total | 17,956,850 | 1,384,885 | 7.7% | 20,687,161 | 1,024,660 | 5.0% |
Source: Author’s calculation based on Lira District sector work plan
2.2.2 Nutrition by Sector
Health Sector
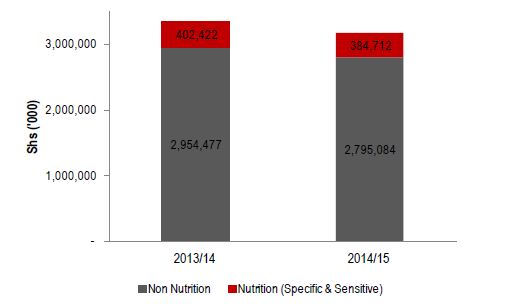
The total health budget was Shs 3.4 billion in 2013/14 and Shs 3.2 billion in 2014/15, of which the amount allocated for nutrition-related activities were Shs 402 million and Shs 385 million in 2013/14 and 2014/15 respectively (see figure 2.5). The largest amount of the health sector nutrition allocation was on healthcare management services and basic healthcare services (see annex 1).
Figure 2.5. Lira Health Sector Nutrition-related Allocation
Production (Agriculture) Sector
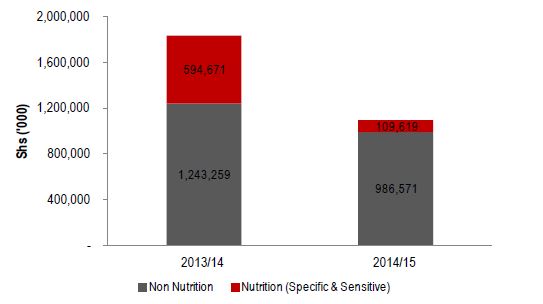
The total production (agriculture) sector budget was Shs 1.8 billion in 2013/14 and Shs 1.1 billion in 2014/15, of which the amount allocated for nutrition-related activities were Shs 595 million and Shs 110 million in 2013/14 and 2014/15 respectively (see figure 2.6). The reduction in allocation is partly attributed to the re-structuring of the National Agricultural Advisory Services (NAADS), which led to the termination of NAADS implementation at local government levels.
Figure 2.6. Lira Nutrition-related Production Sector Allocation
Lower local government agricultural advisory services (i.e. NAADS), district production management services, and technology promotion took the largest share of production sector nutrition-related allocation (see annex 2). Under NAADS, the government is providing agricultural inputs such as seeds for food production. They promote different food stuffs at households and encourage people to plant nutritious foods.
Education Sector
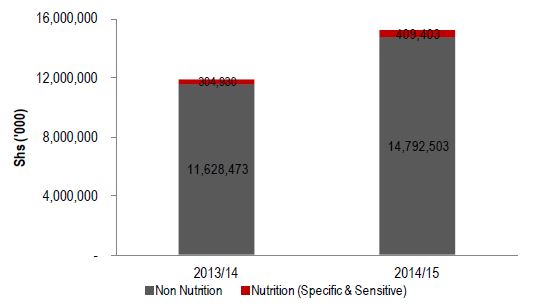
The total education sector budget was Shs 11.9 billion in 2013/14 and Shs 15.1 billion in 2014/15, of which the amount allocated for nutrition-related activities were Shs 305 million and Shs 409 million in 2013/14 and 2014/15 respectively (see figure 2.7).
Figure 2.7. Lira Nutrition-related Education Sector Allocation
Tertiary, secondary, and primary teaching services take the largest share of nutrition-related allocation in the education sector (see annex 3). The education curriculum in primary, secondary, and tertiary education has topics on nutrition (especially biology and home economics), but they are very limited. Also related to school feeding, some School Management Committees have been sensitized on school feeding, and some schools (about 40 percent) are beginning to provide school meals.
Water Sector
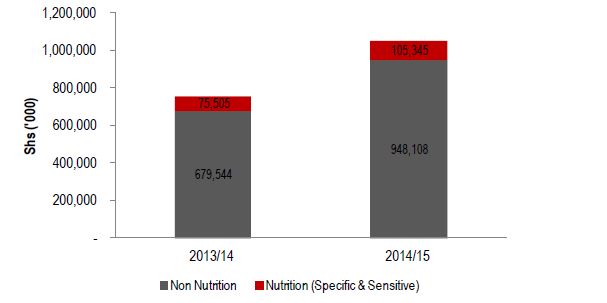
The total water sector (including WASH) budget was Shs 755 million in 2013/14 and Shs 1.1 billion in 2014/15 of which the amount allocated for nutrition-related activities were Shs 75.6 million and Shs 105.4 million in 2013/14 and 2014/15 respectively (see figure 2.8). The large portion of nutrition allocation in the water sector was under provision of safe drinking water through spring protection and borehole drilling and rehabilitation; and promotion of sanitation and hygiene (see annex 4).
Figure 2.8. Lira Nutrition-related Water Sector Allocation
Community-Based Services Sector
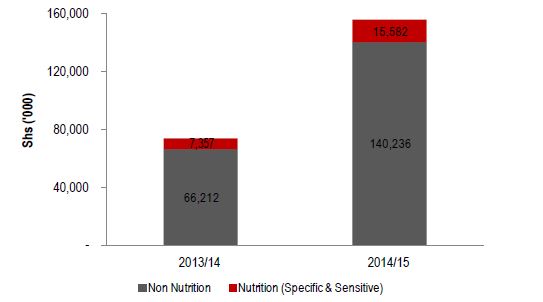
The total community-based services sector encompasses gender and social development. The total community based services sector budget was Shs 73.5 million in 2013/14 and Shs 155.8 million in 2014/15, of which the amount allocated for nutrition-related activities were Shs 7.4 million and Shs 15.6 million in 2013/14 and 2014/15 respectively (see figure 2.9). A large portion of nutrition allocation in the community-based services sector was under operation of the community-based services department, and gender mainstreaming (see annex 5).
Figure 2.9. Lira Nutrition-related Community-based Services Sector Allocation
2.2.3 Nutrition by UNAP Strategic Area
As mentioned in section 1.1.1, the UNAP has 13 strategic areas under five objectives. This analysis shows that Lira district nutrition-related allocation was mainly related to strategic areas 1.1 (Promotion of access to and utilization of nutrition and health services to all women of reproductive age, infants, and young children), 2.1 (Increasing access to and use of diverse nutritious foods at the household level) and 4.1 (Strengthening the policy and legal frameworks for coordinating, planning, and monitoring nutrition activities especially education and training on nutrition). Most allocation under these strategies is under health, production, and education, respectively.
On average over the two FYs, 40.2 percent of nutrition-related allocation was under strategy 1.1, 29.7 percent under strategy 4.1, and 29.2 percent under strategy 2.1 (see figure 2.10).
Figure 2.10. Lira Nutrition-related Allocation by UNAP Strategic Areas
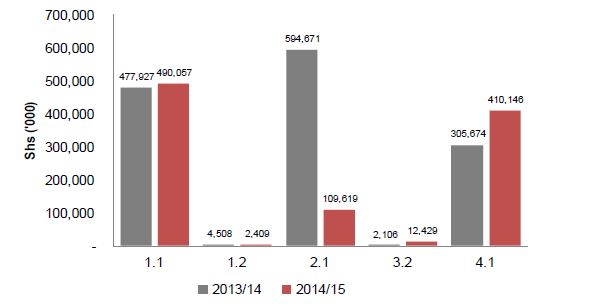
By and large, the UNAP strategic areas which are supposed to be handled by LGs have a large amount of funding. These include: 1.1, 1.2, 2.1, 3.2, and 4.1 (see table 2.3). There is much funding for these areas mainly due to the fact that there is a direct link with specific sectors at LG level. However, this funding is inadequate to make a significant impact at local level.
Table 2.3. Lira Sector Nutrition-related Allocation by UNAP Strategic Areas (Figures in Shs ‘000)
| Sector | UNAP Area | 2013/14 | 2014/15 |
|---|---|---|---|
| Health | 1.1 | 402,422 | 384,712 |
| Production | 2.1 | 594,671 | 109,619 |
| Education | 3.2 | 400 | 400 |
| 4.1 | 304,530 | 409,003 | |
| Water | 1.1 | 75,505 | 105,345 |
| Community Based Services | 1.2 | 4,508 | 2,409 |
| 3.2 | 1,706 | 12,029 | |
| 4.1 | 1,144 | 1,144 | |
| Total | 1,384,885 | 1,024,660 |
Source: Author’s calculation based on Lira district sector work plans
The remaining eight strategic areas, especially 2.2 and 3.1, are not funded. This is partly attributed to the fact that they do not fall in a specific sector at the district level. Many of the activities in these areas are more suited for the regional or national level, such as development oversight of early warning surveillance systems, and promotion of private sector involvement in post-harvest handling. However, with 2.2, there is a specific call for household and community level promotion of improved post-harvest handling technologies, which appears to receive no funding in Lira. According to SPRING’s Snapshots of Nutrition in Uganda: 2014 Compendium, food production does occur in Lira’s sub-region (Pomeroy and D’Agostino, 2014), so unless households are receiving this training and promotion from outside funding sources, there is still a need for government involvement in this area.
2.2.4 Sources of Funding for Nutrition
As discussed above, the major sources of the district funding are mainly: CG transfers, donors, and local revenues. The analysis shows that the government funds over 74 percent of the total nutrition-related allocation. Nutrition-related allocations under education, water, and community-based services sectors are entirely funded by government (see table 2.4). Allocations under UNAP strategic areas 1.2, 3.2 and 4.1 are also entirely funded by government (see table 2.5).
Table 2.4. Lira Sources of Nutrition Funding by Sector (Figures in Shs ‘000)
| Sector | 2013/14 | 2014/15 | ||
|---|---|---|---|---|
| Gov’t | Gov’t & Donor | Gov’t | Gov’t & Donor | |
| Health | 111,402 | 291,020 | 118,998 | 265,713 |
| Production | 579,550 | 15,121 | 71,882 | 37,738 |
| Education | 304,930 | - | 409,403 | - |
| Water | 75,505 | - | 105,345 | - |
| Community-Based Services | 7,357 | - | 15,582 | - |
| Total | 1,078,744 | 306,141 | 721,209 | 303,451 |
Source: Author’s calculation based on Lira district workplans
Table 2.5.Lira Sources of Nutrition Funding by UNAP Strategic Areas (Low) (Figures in Shs ‘000)
| UNAP Strategic Area | 2013/14 | 2014/15 | ||
|---|---|---|---|---|
| Gov’t | Gov’t & Donor | Gov’t | Gov’t & Donor | |
| 1.1 | 186,906 | 291,020 | 224,343 | 265,713 |
| 1.2 | 4,508 | - | 2,409 | - |
| 2.1 | 579,550 | 15,121 | 71,882 | 37,738 |
| 3.2 | 2,106 | - | 12,429 | - |
| 4.1 | 305,674 | - | 410,146 | - |
| Total | 1,078,744 | 306,141 | 721,209 | 303,451 |
Source: Author’s calculation based on Lira district work plans
However, there is off-budget funding from donors or NGOs, which is not captured in the above analysis. In section 2.5, we capture some of the off-budget allocation from NGOs.
2.3 Lira Regional Referral Hospital
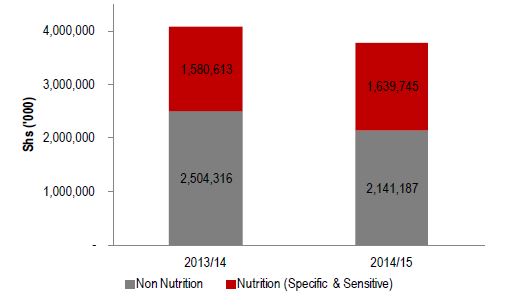
In nominal terms, LRH approved budget was Shs 4.1 billion and Shs 3.8 billion in FY 2013/14 and 2014/15 respectively. Of the total LRH budget, 38.8 percent (Shs 1.58 billion) in 2013/14 and 43.4 percent (Shs 1.64 billion) in 2014/15 was allocated to nutrition-related activities (see figure 2.11). The majority of Lira hospital nutrition allocations are on inpatient and outpatients services, and prevention and rehabilitation services (see annex 6). All the hospital allocations were under UNAP strategy 1.1, which focuses on promotion of, access to, and utilization of nutrition and health services for all women of reproductive age, infants, and young children.
Figure 2.11. Lira RRH Nutrition Allocation
2.4 Medical Supplies
Drugs and medicines from the government are supplied by NMS. Based on the information provided by NMS on drugs and medicines supply, Lira district received Shs 81.2 million in 2013/14 worth of essential nutrition supplies. Over three-quarters of the total supplies were for LRH (see figure 2.12). Over 88 percent of the value of supplies was spent on five supplies: Ampicillin, Glucose, Gentamycin, Ferrous Sulphate, and Zinc Sulphate (see table 2.6).
Figure 2.12. Lira District NMS Essential Nutrition Supplies by Facility Level
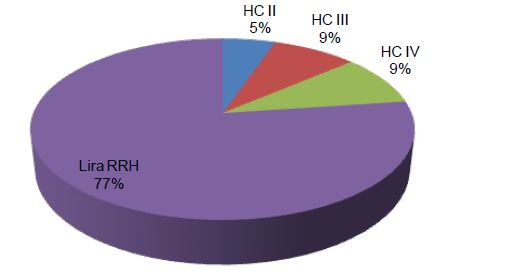
Table 2.6. Lira District NMS Essential Nutrition Supplies by Type
| Type | 2013/14 | 2014/15 |
|---|---|---|
| Ampicillin | 32,326,465 | 39.8% |
| Ferrous Sulphate | 3,795,744 | 4.7% |
| Folic Acid | 715,251 | 0.9% |
| Gentamycin | 6,702,031 | 8.3% |
| Glucose (Dextrose) | 24,715,938 | 30.4% |
| Mebendazle | 1,857,558 | 2.3% |
| Multivitamin Syrup | 981,743 | 1.2% |
| Vitamin A (Retinol) | 2,393,846 | 2.9% |
| Vitamin B Complex | 2,127,628 | 2.6% |
| Vitamin C (Ascorbic Acid) | 266,923 | 0.3% |
| Vitamin K1 (Phytomenadione) | 1,159,624 | 1.4% |
| Zinc Sulphate | 4,131,841 | 5.1% |
| Total | 81,174,592 | 100% |
Source: Author’s calculation based on NMS data
2.5 NGO and Development Partners Nutrition Allocation
There are a number of NGOs and DPs implementing projects in the district, some of which have nutritional components. Despite challenges of getting information on NGOs & DPs allocation, we managed to get data from six NGOs: World Vision, PLAN Uganda, Concerned Parents Association, VEDCO, Development Training and Research Centre (DETREC), and Send a Cow. These NGOs are implementing projects ranging from one to five years. The budgeted amount for FY 2013/14 was Shs 3.11 billon of which Shs 2.23 billion was for nutrition. In 2014/15, the budgeted amount was Shs 1.73 billon of which Shs 1.38 billion was for nutrition (see table 2.7).
Table 2.7. Lira NGOs & DPs Total Budgets (Figures in Shs ‘000)
| Name | Overall Project Budget | 2013/14 | 2014/15 | ||
|---|---|---|---|---|---|
| Total Budget | Nutrition (Specific & Sensitive) | Total Budget | Nutrition (Specific & Sensitive) | ||
| World Vision | 2,628,195 | 607,995 | 607,995 | 637,500 | 637,500 |
| PLAN Uganda | 1,574,868 | 1,496,068 | 1,119,585 | 200,423 | 200,423 |
| Concerned Parents Association | - | 200,000 | 100,000 | 200,000 | 100,000 |
| VEDCO | 497,204 | 186,182 | 93,091 | 313,324 | 193,137 |
| DETREC | 1,181,000 | 622,500 | 311,250 | 270,500 | 135,250 |
| Send a Cow | - | - | - | 111,455 | 111,455 |
| Grand Total | 5,881,267 | 3,112,745 | 2,231,921 | 1,733,202 | 1,377,766 |
Source: Author’s calculation based on NGO & DP data
As shown in table 2.8, most of the NGOs and DPs are implementing activities under UNAP strategic areas 1.2, 2.1, 2.2, 2.3, 3.1, and 3.2. Most of their projects handle nutrition issues with specific emphasis on food and reducing vulnerability to shocks.
Table 2.8. Lira NGO & DP Funding per UNAP Strategic Areas
| NGO | UNAP Strategic Areas | Comment/s |
|---|---|---|
| World Vision | 1.2, 2.1, 2.2, 2.3, 3.1, 4.1, 4.2, 4.3, 4.5, 5.1, & 5.2 | They implement projects on: a) Developing and delivering biofortified crops in Uganda; and b) Northern Uganda Early recovery. |
| PLAN UGANDA | 1.1, & 2.1 | They are implementing projects on: a) promoting food security among vulnerable families; b) Strengthening food security initiatives for vulnerable communities; c) Scaling up CLA (Community-led Action) for children. |
| Concerned Parents Association | 1.1, 1.2, 2.1, 2.2, 2.3, 3.2, 4.3, 5.1, & 5.2 | They implement a project on: Sustaining Comprehensive Response and Vulnerable Children. |
| VEDCO | 1.2, 2.1, 2.2, 2.3, & 3.2 | Implementing projects on: a) Enhancing Women’s Capacities to Support Education of Girls among Selected Households in Lira and Alebtong Districts; b) empowering youth for sustainable development; and c) Agri business cluster project |
| DETREC | 1.2, 2.1, 2.2, 2.3, 3.1, 3.2, 4.4, 5.1, & 5.2 | They implement projects on: a) Community Empowerment Program (school gardening); and b) Food and Nutrition Security. The projects support communities on food and nutrition initiatives like high value food and nutrition security crops. |
| Send a Cow | 2.1 | They implement a project on: livestock management, sustainable organic agriculture, and social dynamics. Nutrition is integrated within their trainings. They do livestock management, sustainable organic agriculture and social dynamics. |
2.6 Total Lira Nutrition Allocation
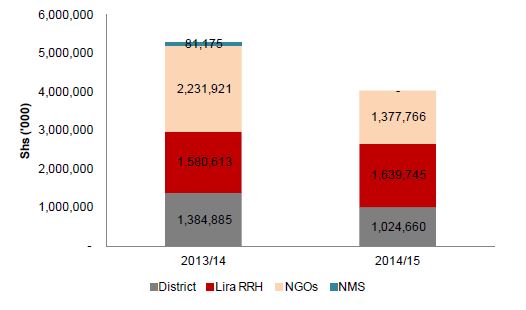
Based on the available data, the total amount of nutrition-related allocations in Lira district during FY 2013/14 was Shs 5.28 billion and Shs 4.04 billion in FY 2014/15 (see figure 2.13). The reduction in total nutrition related allocations is partly attributed to the reduction in the district budget and limited budget information from some NGOs and NMS in 2014/15.
Figure 2.13. Lira Total Nutrition (Specific & Sensitive) Budget Allocations by Funding Source
2.7 Observations
The district has a Nutrition Committee headed by the Chief Administrative Officer (CAO). There is a district nutrition focal person in the education department. Members were selected for the formation of the district nutrition committee according to their interest and support. The committee was launched in 2013 with support from Community Connector. Three sub-county nutrition committees have been formed, and developed their action plans. Plan Uganda has agreed to support the orientation of these committees.
Despite the presence of the committee, there is absence of a structured and multi-sectoral coordination mechanism for effective nutrition policy implementation because there are no funds to run the committee’s activities. In addition, there is also lack of political involvement in the case to scale up nutrition, as there is no political representation on the committee. Political representation would be helpful since the council is in charge of passing the budget.
The UNAP has not been well disseminated at local levels and most district officials interviewed were not fully aware of the UNAP. Various departmental heads were not aware of the UNAP strategic areas and interventions. Partly due to their lack of awareness of the UNAP, some of them were ignorant of any nutrition spending in the sectors. Most district officials think nutrition is a health sector issue. The low awareness of nutrition leads to poor prioritization of nutrition issues in the district and, in turn, low investment of financial and human resources.
As discussed in section 2.1, the district depends largely on CG transfers, which are conditional in nature (meant to be spent on specific activities). This makes it harder for the district to prioritize nutrition spending.
There are quite a few civil society organizations (CSO) doing independent work on nutrition. This leads to disjointed plans and actions on nutrition. However, there is relatively good cooperation between the district and some NGOs. For instance, Community Connector and Plan Uganda are working with the district to strengthen nutrition planning and budgeting.
Summary of Findings, Conclusions, and Recommendations
3.1 Summary of Findings
SPRING’s analysis of Lira district revealed that the total budget allocations for nutrition in the district fell from Shs 5.3 billion in 2013/14 to Shs 4 billion in 2014/15. This reduction can be attributed to reductions associated with the suspension of the National Agricultural Advisory Services (NAADS) funding, as well as measurement error due to limited budget information provided by NMS and by donors for off-budget funding in 2014/15.
Off-budget information provided by six NGOs (World Vision, PLAN Uganda, Concerned Parents Association, Volunteer Efforts for Development, Development Training and Research Centre, and Send a Cow) implementing projects in Lira district shows that, in 2013/14 and 2014/15, Shs 2.23 and Shs 1.38 billion respectively were budgeted for nutrition-related activities. In 2013/14, NGO funding made up 42 percent of the overall district nutrition allocation. This number fell to 34 percent in 2014/15, largely due to sharp reductions in funding by two of the NGOs that had previously contributed 64 percent of the 2013/14 external funding for nutrition. Three other NGOs reported slight increases or no change to their funding levels, while one additional NGO only reported funding for 2014/15.
We found that on-budget nutrition allocations for the four UNAP sectors and water were Shs 1.38 billion in FY 2013/14 and Shs 1.02 billion in FY 2014/15, representing 7.7 percent and 5.0 percent, respectively, of the total district budget allocations for the five sectors. During 2013/14, the GoU funded over 78 percent of on-budget nutrition-related allocations. This dropped only slightly to 70 percent in 2014/15. Nutrition-related allocations under the education, water, and community-based services sectors were entirely funded by the GoU in both years, as were on-budget allocations under UNAP strategic areas 1.2 (Addressing gender and socio-cultural issues that affect maternal, infant, and young child nutrition), 3.2 (Promoting social protection interventions for improved nutrition), and 4.1 (Strengthening the policy and legal frameworks for coordinating, planning, and monitoring nutrition activities).
Similarly, there were significant nutrition-related on-budget funds for essential nutrition supplies provided by the NMS and LRH in both years. LRH reported Shs 1.58 billion in 2013/14, and a modest increase to Shs 1.64 billion in 2014/15. NMS reported Shs 81.2 million in essential nutrition supplies in 2013/14, nearly three-quarters of which was directed to LRH. NMS subsequently failed to report its nutrition-related budget for 2014/15.
We also looked at allocations in Lira by UNAP strategic areas. These allocations fell mainly under strategic areas 1.1 (Promotion of access to and utilization of nutrition and health services to all women of reproductive age, infants, and young children), 2.1 (Increasing access to and use of diverse nutritious foods at the household level) and 4.1. On average during the two FYs, 40.2 percent of nutrition-related allocations fell under strategy 1.1, 29.7 percent fell under strategy 4.1, and 29.2 percent fell under UNAP strategy 2.1.
3.2 Conclusions
The budget allocation to the four UNAP sectors and water is over three-quarters of the total district budget; however, the share of nutrition related allocations was only 8 percent in 2013/14 and 5.0 percent in 2014/15. It should be noted that most sector activities were nutrition-sensitive, with very little or no nutrition-specific activities. The district nutrition-related allocation is mostly under UNAP strategic areas 1.1 (Promotion of access to and utilization of nutrition and health services to all women of reproductive age, infants, and young children), 2.1 (Increasing access to and use of diverse nutritious foods at the household level) and 4.1 (Strengthening the policy and legal frameworks for coordinating, planning, and monitoring nutrition activities especially education and training on nutrition).
3.3 Recommendations
Based on study findings and analysis, SPRING offers the following recommendations, applicable to both Kisoro and Lira districts, for improving nutrition planning and budgeting at local government levels:
- Local governments should identify feasible mechanisms at the district and sub-county levels to provide adequate funding for Nutrition Coordination Committee operations. For example, recommendations from other PBN studies have suggested including a UNAP line item in district-level budgets (Pomeroy-Stevens, et al. 2015; Adero et al. Forthcoming). Donor involvement may also help address the funding gap. However, interviews with district officials suggest that overreliance on unpredictable donor funds can make committee operations less effective.
- Local government should mainstream nutrition into development plans and budgets by—
- sensitizing stakeholders, including sector heads, on the UNAP;
- modifying planning structures to ensure prioritization of nutrition (for example, include nutrition in the OBT
- building knowledge and capacity of lower local government (LLG) officials around the planning, implementation, and budgeting of nutrition-related activities.
- Increase coordination among donors, CSOs, and District Nutrition Coordination Committees (DNCCs) to share annual funding levels for nutrition-related activities in a regular and transparent manner.
- The Ministry of Finance Planning and Economic Development (MoFPED) should include food security and nutrition in its local government allocations formula.
- Continue to advocate for CG prioritization of nutrition. District officials require instructions from the CG to integrate nutrition into their work plans and budgets. This could be accomplished in various ways, including UNAP introductory or sensitization workshops, budget analysis training for nutrition and budget staff, and dissemination of research briefs and key documents on nutrition.
Footnotes
1 Further attempts to rationalize this scale to a more standard breakdown of percentages will be made in the future.
2 Acute malnutrition rates are estimated from the weight for height (WFH) index values combined with the presence of Edema. Global acute malnutrition is defined by WFH < -2 SD and/or existing bilateral Edemas (ACF 2008).
3 which include primary education, primary health care, roads, agriculture extension (especially NAADS) and rural water and sanitation
References
ACF. 2006. Nutrition Survey report IDP camps, Lira district, Northern Uganda.
Adero, Nancy, Edgar Agaba, Abel Muzoora, Daniel Lukwago, Hannah Foehringer Merchant, Alexis D’Agostino, Ezekiel Mupere, and Amanda Pomeroy-Stevens. Forthcoming. “District Technical Brief: Summary of Qualitative Findings in Kisoro and Lira Districts, Uganda - 2014 and 2015.” Pathways to Better Nutrition Case Study Evidence Series. Arlington, VA: SPRING Project.
Bread for the World. 2011. “Implementing Nutrition-Sensitive Development: Reaching Consensus.” Briefing paper (pages 13, 14). http://www.bread.org/institute/papers/nutrition-sensitive-interventions.pdf
Government of Uganda. 2011. “Uganda Nutrition Action Plan 2011-2016: Scaling Up Multi-Sectoral Efforts to Establish a Strong Nutrition Foundation for Uganda’s Development.”
Lancet, The. 2013. “Executive Summary of The Lancet Maternal and Child Nutrition Series.” The Lancet Global Health 382 (9890).
Lira District Local Government. 2011. “Annual Budget Estimates FY 2011/12.”
Lira District Local Government. 2011. “Annual Work Plan FY 2011/12.”
Lira District Local Government. 2012. “Annual Budget Estimates FY 2012/13.”
Lira District Local Government. 2012. “Annual Work Plan FY 2012/13.”
Lira District Local Government. 2013. “Annual Budget Estimates FY 2013/14.”
Lira District Local Government. 2013. “Annual Work Plan FY 2013/14.”
Mucha, Noreen. 2012. “Implementing Nutrition-Sensitive Development: Reaching Consensus.” Bread for the World, Paper #20. Washington, DC: Bread for the World.
Pomeroy, Amanda, Alexis D’Agostino. 2014. Snapshots of Nutrition in Uganda: 2014 Compendium. Arlington, VA. USAID/Strengthening Partnerships, Results, and Innovations in Nutrition Globally (SPRING) Project.
Pomeroy-Stevens, Amanda, Alex D’Agostino, Hannah Foehringer Merchant, Jolene Wun, Abel Muzoora, Madhukar B Shrestha, Nancy Adero, and Indu Sharma. 2015. “For the Long Haul: Financing Sustained Commitment to Nutrition.” Technical Brief. Pathways to Better Nutrition Case Study Evidence Series. Arlington, VA: SPRING. https://www.spring-nutrition.org/sites/default/files/publications/briefs....
SUN Donor Network. 2013. “SUN Donor Network: Methodology and Guidance Note to Track Global Investments in Nutrition.” http://scalingupnutrition.org/wp-content/uploads/2013/12/RESOURCE_TRACKI....
UBOS. 2014. “Uganda National Population and Housing Census 2014.” Provisional Results