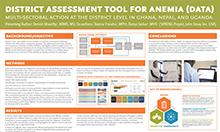
The Anemia Landscape Analysis Tool, an Excel-based tool, allows you to present information on the anemia situation in your country in a format that can be shared with stakeholders. The Excel-based Anemia Landscape Analysis Tool and User’s Guide is available for download above.
You can include the output of the tool in your landscape analysis or present it as a standalone document. You can complete this tool at any point in your landscape analysis process, but we recommend reviewing all the information in the guidance on how to conduct an anemia landscape analysis before downloading and using the tool.
Completing this tool is best done as a collaborative process. The Excel file is formatted so you can print the three questionnaires and complete them with colleagues before entering data into the tool.
- Prevalence Questionnaire: Captures information related to national anemia prevalence, as well as risk factors for anemia, including infection, inflammation, micronutrient deficiencies, and genetic red blood cell disorders. You can include up to two years of data for each indicator and disaggregate anemia prevalence by region.
- Program Questionnaire: Captures information on the current status of interventions for anemia reduction and control. Program data is often available from a variety of sources; an optional worksheet allows you to track different estimates. The questions are divided into the following topics: nutrition, disease control, water and sanitation, reproductive health, agriculture, and genetic counseling and management.
- Strategy/Policy Questionnaire: Captures information on which anemia-related policies or strategies are in place.
Data from questionnaires are compiled and summarized in two dashboards. The dashboards will automatically update to reflect new information as you add it to the questionnaires. You can print the dashboards to share with stakeholders or incorporate the tables and graphs into other materials.
- Overview Dashboard: Provides a “snapshot” of the situation of anemia at the regional and national levels, as well as the risk factors for anemia. The information is populated from the prevalence questionnaire.
- Findings Dashboard: Includes a summary of interventions to address anemia, summarized by topic area. Information is presented on policies and the existence of programs and their coverage. High impact interventions are presented graphically. The dashboard also highlights the various sectors that have to be involved in the integrated control of anemia.

