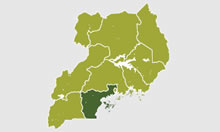
DESCRIPTION OF CENTRAL 1 CHARACTERISTICS (IN COMPARISON TO OTHER SUBREGIONS)
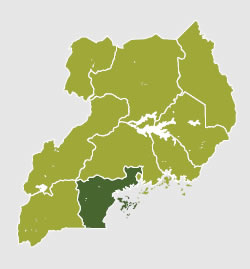
Location: Rural
Households in lowest national wealth quintile*: Below Average (6%)
Households reporting conflict or raiding as an issue: Below Average (0%)
Literacy rate for women of reproductive age (WRA): Above Average (80%)
Refugee population level: Low
Notes:
*Considered a measure of poverty.
Location definitions are derived from the number of population living in the following categories: >500 persons per sq km=Urban, >300 persons per sq km=Peri-Urban, 300 persons per sq km=Rural.
Average literacy and wealth index quintiles defined from the national average of UDHS 2011 indicators.
Households reporting conflict or raiding based on national average of 1%
Refugee population measured by existence of: no refugee settlements=Low, one refugee settlement=Medium, more than one refugee settlement=Moderate/High
Sources: UNHCR 2013, UBOS CountrySTAT 2009, UBOS & ICF 2011, UBOS and WFP 2009.
SUMMARY OF KEY UNAP INDICATORS FOR CENTRAL 1 SUBREGION
| Indicator | Level in Central 1 | UNAP National Target (2016) |
|---|---|---|
| Any anemia, children 6–59 months1 | 56.8% | 50.0% |
| Any anemia, WRA1 | 23.5% | 12.0% |
| Any anemia, WRA1 | 23.5% | 12.0% |
| Calorie consumption (average calories)3 | 1998 calories | 2500 calories |
| Exclusive breastfeeding, under 6 months1 | 58.8% | 75.0% |
| Exclusive breastfeeding, under 6 months1 | 58.8% | 75.0% |
| Low birthweight (2.5kg)1 | 14.4% | 9.0% |
| Minimum acceptable diet (MAD), children under 2 yrs.1 | 4.4% | * |
| Overweight, children under 5 yrs.1 | 4.3% | No increase** |
| Overweight, non-pregnant women1 | 23.3% | No target |
| Stunting, children under 5 yrs.1 | 32.5% | 32.0% |
| Underweight, children under 5 yrs.1 | 12.9% | 10.0% |
| Underweight, non-pregnant women1 | 7.3% | 8.0% |
| Vitamin A deficiency, children 6–59 months2 | 29.1% | 13.0% |
| Vitamin A deficiency, WRA2 | 32.7% | 12.0% |
| Wasting, children under 5 yrs.1 | 5.8% | 5.0% |
Sources:
1 UBOS and ICF (2011), 2UBOS and ICF (2012), 3UBOS (2006)
* UNAP provides a target for a dietary diversity index of 75, but this measure is unavailable for Uganda's subregions.
** Overweight indicators are not given targets by UNAP; for these, the SUN/WHO target for 2025 is given.
PRIMARY FOODS EATEN (GREATER THAN 10% OF DIET), BY RANK AND SOURCE
| Rank | Food Type | Contribution to Caloric Intake | Amount Purchased | Amount Grown | Amount as Gift |
|---|---|---|---|---|---|
| 1 | Matooke | 31.4% | 41% | 54% | 5% |
| 2 | Cereals | 24.6% | |||
| Rice | 94% | 0% | 6% | ||
| Maize-Grain | 35% | 55% | 10% | ||
| Maize-Flour | 81% | 16% | 3% | ||
| Bread | 94% | 0% | 5% | ||
| Millet | 77% | 18% | 4% | ||
| Sorghum | 100% | 0% | 0% | ||
| 3 | Roots and Tubers | 20.1% | |||
| Sweet potatoes | 29% | 66% | 6% | ||
| Cassava-Fresh | 26% | 69% | 5% | ||
| Cassava-Flour | 73% | 23% | 5% | ||
| Irish potatoes | 74% | 22% | 4% | ||
| 4 | Legumes and Pulses | 10.7% | |||
| Fresh beans | 27% | 62% | 11% | ||
| Dry beans | 46% | 51% | 3% | ||
| Groundnuts | 83% | 13% | 4% | ||
| Peas | 97% | 3% | 0% | ||
Source:
Ssewanyana & Kasirye (2010)
This subregional snapshot is one of ten snapshots constructed as part of the "Pathways to Better Nutrition" case study evaluations implemented by SPRING. Using key indicators and objectives named in the 2011 Uganda Nutrition Action Plan (UNAP), these snapshots present the diversity of factors affecting malnutrition in the country. One can best interpret these snapshots as a set, assessing what objectives or set of constraints are most pressing in each subregion. The contextual factors that will affect subnational implementation of national nutrition policy may vary across regions.
Sources:
Africa Health Workforce Observatory. 2009. Human Resources for Health Country Profile: Uganda. World Health Organization.
Government of Uganda. 2011. 2011-2016 Uganda Nutrition Action Plan: Scaling Up Multi-Sectoral Efforts to Establish a Strong Nutrition Foundation for Uganda's Development. Kampala, Uganda: Government of Uganda.
Ssewanyana, Sarah and Ibrahim Kasirye. 2010. "Food Insecurity in Uganda: A Dilemma to Achieving the Hunger Millennium Development Goal." Economic Policy Research Centre. Research Series No. 70. July 2010.
Uganda Bureau of Statistics (UBOS). 2006. 2002 Uganda Population and Housing Census: Analytical Report. Population Size and Distribution. Kampala, Uganda: UBOS.
UBOS. 2013. District profiles by selected indicators. Data received: 7 February 2013.
UBOS CountrySTAT Database (object name CFSVA2009); accessed January 14, 2014, http://countrystat. org/home.aspx?c=UGA&tr=231
UBOS and ICF International Inc. 2012. Uganda Demographic and Health Survey 2011. Kampala, Uganda: UBOS and Calverton, Maryland: ICF International Inc.
UBOS and ICF International Inc. 2012. Uganda Demographic and Health Survey 2011: Vitamin A Addendum. Kampala, Uganda: UBOS and Calverton, Maryland: ICF International Inc.
Uganda Ministry of Health (MOH). 2012. Annual Health Sector Performance Report: Financial Year 2011/2012. Kampala, Uganda: MOH.
UBOS and United Nations World Food Programme (UNWFP). 2009. Comprehensive Food Security & Vulnerability Analysis (CFSVA): Uganda. Kampala, Uganda: UBOS and UNWFP.
Uganda MOH and Macro International Inc. 2008. Uganda Service Provision Assessment Survey 2007. Kampala, Uganda: MOH and Macro International Inc.
United Nations High Commissioner for Refugees (UNHCR). 2013. "2013 UNHCR country operations profile-Uganda." Accessed August 22, 2013: http://www.unhcr.org/pages/49e483c06.html.