Executive Summary
Bangladesh has made substantial progress in improving the health and nutrition of women and children, but absolute levels of undernutrition are still high. According to the 2014 Bangladesh Demographic Health Survey, stunting is elevated at 36 percent, and wasting stands at 14 percent. The U.S. Agency for International Development’s (USAID) Feed the Future initiative aims to reduce undernutrition among women and children through interventions focusing on poverty and hunger, especially through nutrition-sensitive agriculture interventions, such as the USAID-funded Strengthening Partnerships, Results and Innovations in Nutrition Globally (SPRING) project. SPRING builds on past USAID investments and its partner expertise to deliver high-impact nutrition interventions, such as infant and young child feeding (IYCF), control of micronutrient deficiencies, and maternal nutrition practices focusing on the 1,000 days from pregnancy through the child’s first two years of life. SPRING was implemented in Bangladesh from 2012 until 2017, directly training more than 22,000 individuals in government and private systems in both health and agriculture sectors. Constituting a multifaceted program with a variety of interventions, SPRING activities in Bangladesh resulted in contacts with more than 11.5 million people, primarily pregnant and lactating women and women with children under 2 years of age, focusing on the two poorest wealth quintiles.
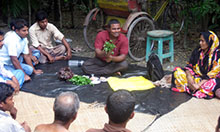
SPRING’s interventions included an innovation called farmer nutrition school (FNS), a 9-month, 18-session training that teaches groups of women about homestead food production, while also promoting essential nutrition actions and essential hygiene actions. SPRING also worked directly with the Ministry of Health and Family Welfare (MOHFW) and Ministry of Agriculture (MOA) to build capacity in nutrition among government staff and to add or improve nutrition services for the ministries’ programs. Due to rapid scale-up and the low-input method of interventions, an impact assessment was not originally planned for the project. However, by merging data from existing surveys carried out by Helen Keller International (HKI) under a separate program with original data collected by SPRING, it was possible to estimate SPRING’s impact compared to other areas of the Feed the Future zone of influence. The ability to isolate SPRING’s impact in the assessment is limited because many other nutrition programs were active throughout the Feed the Future zone at the same time as SPRING—there were no working areas where SPRING was the sole implementing project and no areas of the Feed the Future zone where no other projects were operating. Therefore, intervention areas had some activities beyond SPRING (although SPRING did try to work in areas less covered by others), and comparison areas included nutrition activities. This assessment can best be seen as measuring impact as the value added by the SPRING package of activities on key indicators, when compared to other Feed the Future areas where SPRING was absent but other health and nutrition projects were active.
The assessment included 26 upazilas, or sub-districts: 15 from the area where SPRING operated and 11 from other areas of the Feed the Future zone. For both the baseline and endline, data collection was done over approximately 12 months. The surveys were carried out in households with children under 5 years of age in the poorest two wealth quintiles, with a focus on SPRING’s target population of pregnant and/or lactating women (PLW) and children under 2 years of age. We estimated the main impact of SPRING interventions using simple double difference techniques, measuring the difference between the baseline and endline results in the SPRING intervention areas, the baseline to endline difference in other Feed the Future areas not supported by SPRING, and then calculated the difference between the two. Additionally, for each indicator, we also used regression analysis and modified double difference analysis to determine the extent to which systematic differences existed across area and time, and to measure the association between the intensity of SPRING activities (based on the percentage) of households reached by SPRING in each upazila and each outcome variable measured in this study. The modified double difference estimate for area shows whether any given indicator was systematically higher or lower in the SPRING areas compared with the non-SPRING areas, showing—independent of the simple double difference results—whether SPRING was operating in areas systematically different from the comparison areas (as was often the case because SPRING tended to focus on the most vulnerable areas and populations). The modified double difference estimate for time shows whether there was a generalized change in both areas, over time, which is sometimes useful to see why the simple double difference might not be significant even if the change in the indicator was large (over time, it may have generally increased in both SPRING and non-SPRING areas). Finally, the modified double difference for reach shows the extent to which impact was affected by the degree of coverage (percentage reached for children under 2) in SPRING upazilas versus the comparison group. All estimates were made after accounting for key background characteristics and controlling for the clustering in survey data. Tables in this report show levels of statistical significance and indicate when p values are <0.1, <0.05, and <0.01.
Results
This study measured changes in many key nutrition outcome indicators, over time. The main ones are shown in Table 1:
Table 1. Nutrition Outcome Indicators for SPRING/Bangladesh
| Breastfeeding | Food Production | Women’s Diet | Children’s Diet | Food Security | Nutritional Status |
|---|---|---|---|---|---|
| Percentage of children breastfed within the first 24 hours after birth | Percentage of households with homestead gardens with both fruits and vegetables | Percentage of women consuming a diverse diet (5+ food groups) | Percentage of children aged 6–23 months consuming a diverse diet | Percentage of households experiencing food deficits | Percentage of children who were stunted |
| Percentage of children given pre-lacteal feeds | Percentage of households rearing poultry | Mean women’s dietary diversity score | Percentage of children aged 6–23 months receiving acceptable feeding frequency | Percentage of households with poor/borderline/low food consumption | Percentage of children who were severely stunted |
| Percentage of children aged 0-5 months who are exclusively breastfed | Percentage of households with both gardens and poultry | Percentage of women with chronic energy deficiency | Percentage of children aged 6–23 months receiving a minimum acceptable diet (MAD) |
Overall results of the assessment suggested that SPRING had a significant impact on several outcomes. For eight out of the 16 indicators, the improvement in SPRING-supported upazilas was significantly higher than in comparison areas, as measured by simple double difference analysis, with at least 90 percent confidence. The areas showing the greatest impact or value added were children’s dietary diversity and severe stunting. Significant impact was also seen on food production through household gardens, some breastfeeding indicators, and maternal nutrition. Almost all indicators moved in the hypothesized direction in SPRING-supported areas. Many indicators, such as food security, women’s body mass index (BMI), stunting, and wasting improved substantially in both SPRING and non-SPRING areas. While this is a very positive result for Feed the Future and Bangladesh, for this study it meant that we cannot claim that SPRING’s impact for those indicators was significantly greater than other Feed the Future implementation areas. The small sample size of the survey respondents also may have precluded us from detecting significant changes in some indicators.
Food production and food security. Food production interventions were a major focus of SPRING’s programming. The percentage of households with gardens, and those with both gardens and poultry, increased in the Feed the Future zone, as a whole, with the increase greater in SPRING areas than in other Feed the Future areas. SPRING areas had a much higher odds ratio for having a garden (OR 2.2, P<0.05). The percentage of households with poultry, and with both poultry and gardens, increased slightly in both the SPRING and comparison areas, with slightly higher increases in SPRING-supported areas. Increases in rates of poultry rearing were tempered because they were already high at baseline.
The percentage of households experiencing food deficits and consuming sub-optimal diets fell dramatically in the Feed the Future zone, as a whole, with the decline being similar between SPRING and other Feed the Future areas. SPRING targeted the two lowest wealth quintiles in our programming. Operating in areas of greatest need, at baseline, SPRING areas had higher rates of food deficits and consumption of sub-optimal diets. Because the improvements were similar in both SPRING and non-SPRING upazilas, the impact of SPRING, as measured by simple double difference, was not significant.
Maternal nutrition. Maternal dietary diversity did not change dramatically in either SPRING or other Feed the Future areas, increasing by 0.1 percentage point in SPRING areas and declining by 0.1 points in other Feed the Future areas. The simple double difference, however, was significant (p<0.1). In line with this, the percentage of women with a dietary diversity score of five or more increased in the SPRING areas, while it declined in the other Feed the Future areas, and the change was again significant (p<0.1). The percentage of women eating eggs increased in both areas, with the change in SPRING areas being greater. The percentage eating fish increased significantly in both areas. Simple difference-in-difference comparisons for both indicators were not significant. The intensity of SPRING interventions, measured by modified double difference, was significant for eggs (p<0.1), but not for fish.
The percentage of mothers with a low BMI (less than 18.5) decreased between baseline and endline in both SPRING and non-SPRING areas, but there was no significant difference between SPRING and the other areas, or association with the intensity of SPRING interventions. Note that women in SPRING areas had higher rates of low BMI at baseline than the other Feed the Future areas.
Infant and young child feeding. The percentage of infants who were breastfed in the first hour of life, and exclusively breastfed during the first six months, increased slightly in SPRING areas, but decreased in the other areas of the Feed the Future zone. The simple double difference estimate was significant (p<0.1) for early initiation of breastfeeding, but not for exclusive breastfeeding. A dramatic decline was seen in the percentage of children fed foods in the first days of life in the SPRING areas, with a smaller decline in other Feed the Future areas. The percentage of infants who received such pre-lacteal feedings was significantly and inversely associated with the reach of the SPRING intervention (p<0.05), based on the modified double difference for reach. For each percentage point increase in the percentage of children reached by SPRING upazilas (and by association, the percentage of mothers reached), there was a 7 percent reduction in the odds of children receiving pre-lacteal feeds.
Children’s dietary indicators improved significantly in SPRING areas, relative to other Feed the Future areas, for children 6–23 months of age. Dietary diversity, minimum feeding frequency, and minimum acceptable diet (MAD) all improved in SPRING supported areas, while they declined in the other Feed the Future areas. Simple double difference estimates for dietary diversity and MAD were significant (p<0.01 and p<0.05, respectively). The simple double difference for feeding frequency was not significant, but the percentages receiving at least the minimum number of feeds was very high to start (81 percent in SPRING areas, 95 percent in non-SPRING), so significant change would be harder to achieve. All three child diet indicators were also significantly associated with the SPRING reach, suggesting that this was an area where intensity of SPRING’s work impacted the outcomes. Each percentage point increase in the percentage of children reached in an upazila by the SPRING intervention was associated with a 14 percent increase in the odds of a child being fed with minimal dietary diversity, a 22 percent increase in the odds of a child being fed with minimal frequency, and an 11 percent increase in the odds of a child being fed a minimally acceptable diet.
Child nutritional status. Chronic undernutrition, measured by stunting, declined in SPRING areas while remaining the same in other Feed the Future areas. While the simple double difference for stunting was not significant, it was significant for severe stunting. In SPRING areas, severe stunting decreased from 16 percent to 10 percent, while increasing in other Feed the Future areas from 7 percent to 12 percent. Further, the modified double difference for reach was also significant with an odds ratio of 0.9, meaning that each percentage point increase in the children reached by SPRING was associated with a 10 percent decrease in severe stunting. The percentage of children who were wasted declined substantially in both SPRING and other Feed the Future areas; the simple double difference was not significant.
In summary, this assessment found that SPRING had a significant impact on nutrition indicators, especially child feeding practices and severe stunting, with smaller impacts on household food production and maternal diets.
Results from the study should be interpreted with caution, given that other programs were operating throughout the Feed the Future zone, in both SPRING and non-SPRING upazilas. Nevertheless, the positive results suggest that many nutrition practices improved during the study, and that SPRING interventions contributed to those improvements, adding value to other, ongoing activities. The study provides evidence that adopting a comprehensive SPRING approach in other parts of the Feed the Future zone could potentially add value, improving the nutrition outcomes.
Introduction
Bangladesh has made substantial progress in improving the health and nutrition of women and children in recent years, but the absolute levels of malnutrition are still very serious (NIPORT, Mitra and Associates, and ICF International 2016). A number of interventions are being implemented through the Government of Bangladesh, multilateral and bilateral agencies, and international and national nongovernmental organizations (NGOs). One program is the Strengthening Partnerships, Results, and Innovations in Nutrition Globally (SPRING) project—a six-year initiative funded by the U.S. Agency for International Development (USAID) to provide state-of-the-art technical support and to facilitate country-led, regional and global programs to improve the nutritional status of women and children.
SPRING builds on past USAID investments and its partners’ expertise to deliver high impact nutrition interventions, including infant and young child feeding (IYCF), control of micronutrient deficiencies, and maternal nutrition practices focusing on the 1,000 days from pregnancy through the child’s second year of life. SPRING is also leading efforts to strengthen the evidence base and to build on, clarify, and strengthen the understanding, application, and use of the most promising nutrition-sensitive agriculture interventions.
In Bangladesh, SPRING had four primary objectives:
Objective 1: Scale up the promotion and the support of essential nutrition actions/essential hygiene actions (ENA/EHA) within the Ministry of Health and Family Welfare (MOHFW), the Ministry of Agriculture (MOA), and other health and agriculture projects in Barisal and Khulna divisions.
Objective 2: Enhance the capacity of frontline health and agriculture workers within the MOHFW and MOA and community workers and groups through training, supportive supervision, and community mobilization to deliver quality services and counseling on ENA/EHA for pregnant and/or lactating women (PLW) and children under 2 years in Khulna and Barisal divisions.
Objective 3: Increase household access to and utilization of diversified foods using the farmer nutrition school (FNS) approach.
Objective 4: Enhance project learning and sharing.
Objectives 1, 2, and 3 measure direct interventions to improve nutrition among PLW and children under 2 years of age. SPRING directly implemented interventions in 40 upazilas, or sub-districts, in Barisal and Khulna divisions, part of the Feed the Future zone of influence (ZOI). SPRING enables and mobilizes individuals and communities to promote and adopt healthy behaviors, particularly for nutrition, through a multi-channel approach that includes both direct implementation through the FNS and support to the Government of Bangladesh, through the MOA and the MOHFW.
Of these initiatives, FNS is a nine-month, 18-session training that teaches groups of women about food production on small-scale farms near their homes. It combines elements of the Farmer Field School approach, originally pioneered by the Food and Agriculture Organization of the United Nations (FAO 2016) and DANIDA, and homestead food production pioneered by Helen Keller International (HKI 2014a). The main innovation of FNS was to incorporate the promotion and support of the ENA and the EHA into each FNS session, thereby adding nutrition and hygiene to more traditional food production modules of vegetable gardening, poultry rearing, and aquaculture (Guyon et. al 2009; FSN 2015). FNS messages, based on small, doable actions, give participants practical knowledge and skills to link food production with improved nutrition and hygiene practices, with the aim to impact outcomes in all three areas.
In addition to FNS, SPRING also worked directly with the MOHFW and MOA to build capacity in nutrition among government staff and to add or improve nutrition services to the ministries’ programs. In the health sector, SPRING worked with the MOHFW network of community clinics, training frontline health providers in nutrition, providing social and behavior change communication (SBCC) materials, and enhancing capacity and quality through joint supportive supervision visits. In agriculture, SPRING built the capacity of frontline agriculture workers, training them to provide nutrition services to community members as part of their agriculture extension work.
Through these activities, SPRING trained more than 22,000 people in various aspects of nutrition-related services, including 9,853 frontline health workers and other health sector staff; 3,613 agricultural extension workers and other agriculture sector staff; and 8,700 collaborative partners and others. SPRING programs resulted in contacts with over 11.5 million women with more than 6.2 million children under 2 years of age. Most contacts (8,633,352) were through the health system, plus 1,377,529 through agriculture extension services, and almost 1.5 million through FNS and others. More than 125,000 unique women, representing approximately 60 percent of the PLW in the two poorest wealth quintiles, participated in the FNS program through the 6,500 schools established by SPRING during the project.
Frontline health workers, agricultural extension workers, and FNS facilitators used SBCC approaches to promote small, doable actions that would be easily understood and practiced by beneficiaries. By promoting messages and actions through multiple channels, SPRING aimed to improve the potential for adoption within a short timeframe.
Figure 1 illustrates SPRING’s conceptual framework to achieve improved nutrition outcomes and contribute to reduced stunting.
Figure 1. Conceptual Framework for SPRING/Bangladesh
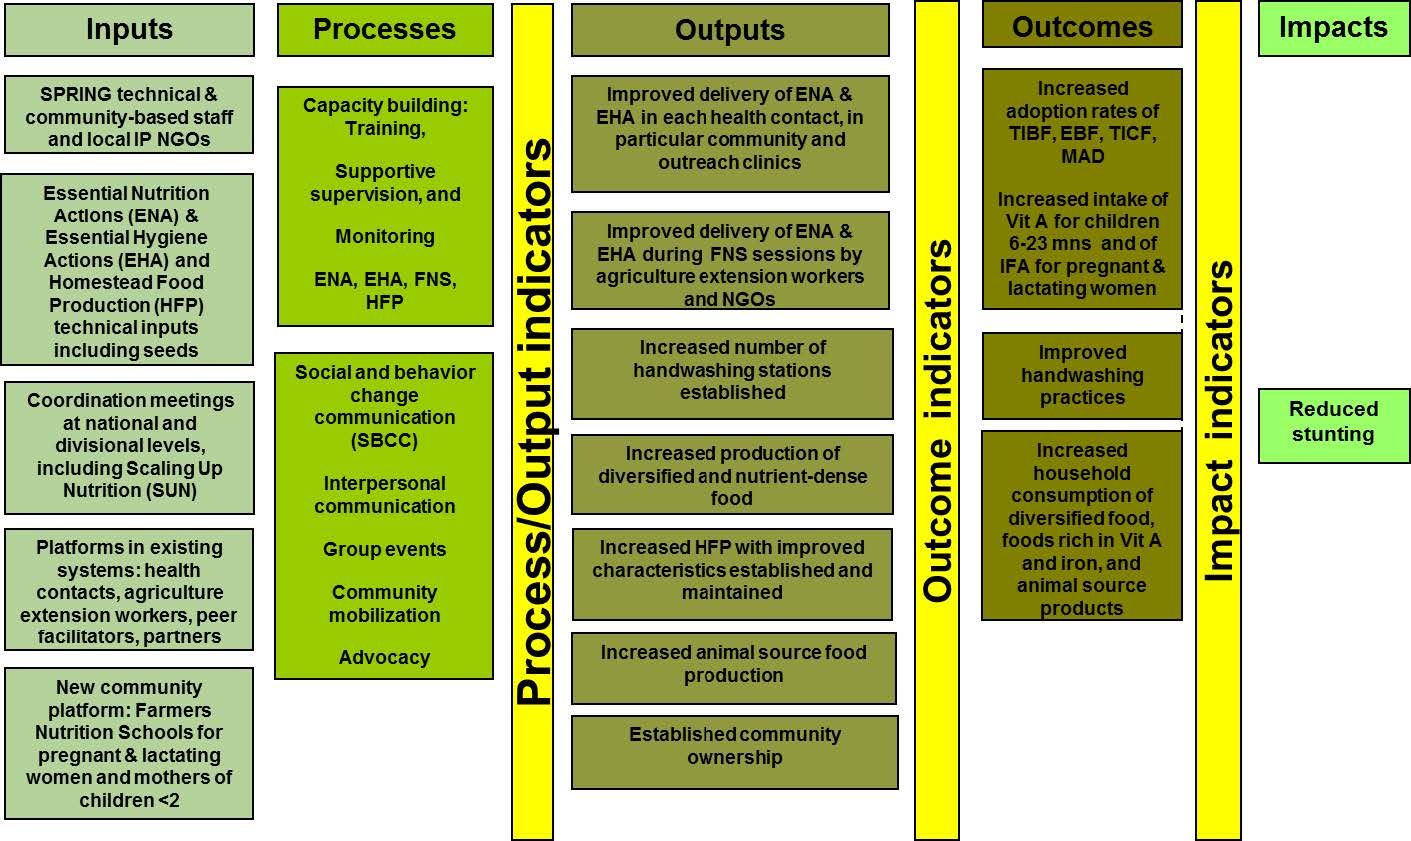
The main indicators described in this report come from the outcome indicators and the longer term impact indicator of stunting.
Methodology
This assessment compares changes, over time, in key nutrition outcomes and practices in SPRING-supported upazilas, compared to other areas of the Feed the Future zone not supported by SPRING. These other areas benefited from other nutrition interventions. However, the current study is only a rough assessment of SPRING’s impact (value added) on nutrition outcomes compared with other combinations of interventions. Because this was the primary target group for SPRING, the assessment focuses on households in the poorest two quintiles with children under 5 years, and a special focus on PLW and children under 2 years.
We will review indicators of—
- food production and food security
- nutrition practices of mothers and children younger than 2 years of age, including breastfeeding
- nutritional status of mothers and children under 5 years of age.
Most of the data for this assessment comes from surveys carried out by the Food Security and Nutrition Surveillance Project (FSNSP) and a separate USAID-funded Feed the Future monitoring system, which was a follow-on to FSNSP from 2013 to 2016 using a similar design and sampling frame. Because those survey rounds covered both SPRING-supported and non-SPRING upazilas, they allowed for a rough natural experiment using secondary analysis, in which data on key FSNSP indicators could be separated into SPRING-supported and non-SPRING upazilas in the year before SPRING began, and then compared to results in the same upazilas during the final year of SPRING.
We analyzed four datasets for this assessment. The baseline consisted of three rounds of FSNSP surveys (secondary analysis), coupled with additional upazilas added for SPRING during one of the FSNSP rounds, and used a slightly modified questionnaire (called the SPRING “oversample”). All baseline data were collected during one year before SPRING’s programmatic interventions began. The endline data consisted of two rounds of surveys from the USAID-funded Feed the Future monitoring system (secondary analysis), coupled with a final round that SPRING undertook using the same methodology, but with a slightly modified questionnaire. The modifications in the questionnaire in the surveys carried out directly by SPRING were to eliminate questions on topics not covered by SPRING, and to add more detailed questions on topics of special interest (e.g., specific characteristics of homestead gardens, exposure to SPRING, etc.). Both baseline and endline survey rounds covered approximately 12 months. Table 2 shows the dates and location for each round of data collection.
Table 2. Dates of Data Collection, Sources of Data, and Upazilas Sampled
| Period | Dates | Data Source | SPRING Upazila Included | Non-SPRING Upazilas |
|---|---|---|---|---|
| Baseline | October 2–December 29, 2011 | FSNSP, Round 6 | Babuganj, Banari para, Bauphal, Chitalmari, Mirzaganj, Paikgacha, Phultala, Wazirpur | Char Bhadrasan, Jhalokathi Sadar, Mujib Nagar, Rampal, Zianagar |
| February 22–May 5, 2012 | FSNSP, Round 7 | Abhaynagar, Agail Jhara, Babuganj, Bamna, Banari Para, Bauphal | Barguna Sadar, Kanthalia, Lohagara, Sadarpur | |
| June 4–August 12, 2012 | FSNSP, Round 8 | Bamna, Gaurnadi, Kalia, Mirzaganj | Barguna Sadar, Char Bhadrasan, Jhalokathi Sadar, Kanthalia, Pangsa, Sadarpur, Shalikha, Zianagar | |
| June 23–September 2, 2012 | SPRING “oversample” | Banaripara, Chitalmari, Lalmohon | Narail Sadar* | |
| Endline | February 10–May 4, 2016 | Feed the Future monitoring, Round 9 | Babuganj, Bamna, Kalia | Jhalokathi Sadar, Shalikha |
| May 26–August 17, 2016 | Feed the Future monitoring, Round 10 | Banari Para, Phultala | Char Bhadrasan, Kanthalia, Sadarpur, Zianagar | |
| October 22–December 6, 2016 | SPRING Endline | Abhaynagar, Agailjhara, Bauphal, Chitalmari, Gaurnadi, Lalmohon, Mirzaganj, Narail Sadar, Paikgacha, Wazirpur | Barguna Sadar, Lohagara, Mujib Nagar, Pangsa, Rampal |
By collecting data during a complete year, the assessment partially controlled for seasonality in its estimation of key indicators. Furthermore, although the full list of upazilas sampled in the survey rounds that were combined in this assessment varied greatly between the two years in this assessment, for this analysis we limited the upazilas that were included in both periods to reduce the random variation in the sample, in line with United Nations statistical office recommendations (United Nations 2005). Because of this exclusion, the assessment includes 26 upazilas, 15 from SPRING intervention areas and 11 from other areas of the Feed the Future zone (see Table 1), with the same upazilas included in both baseline and endline. From the SPRING project areas, we included both upazilas where the intervention began in 2012 and those that began in 2013.
Figure 2. Sampled Areas of the SPRING Endline Evaluation Study
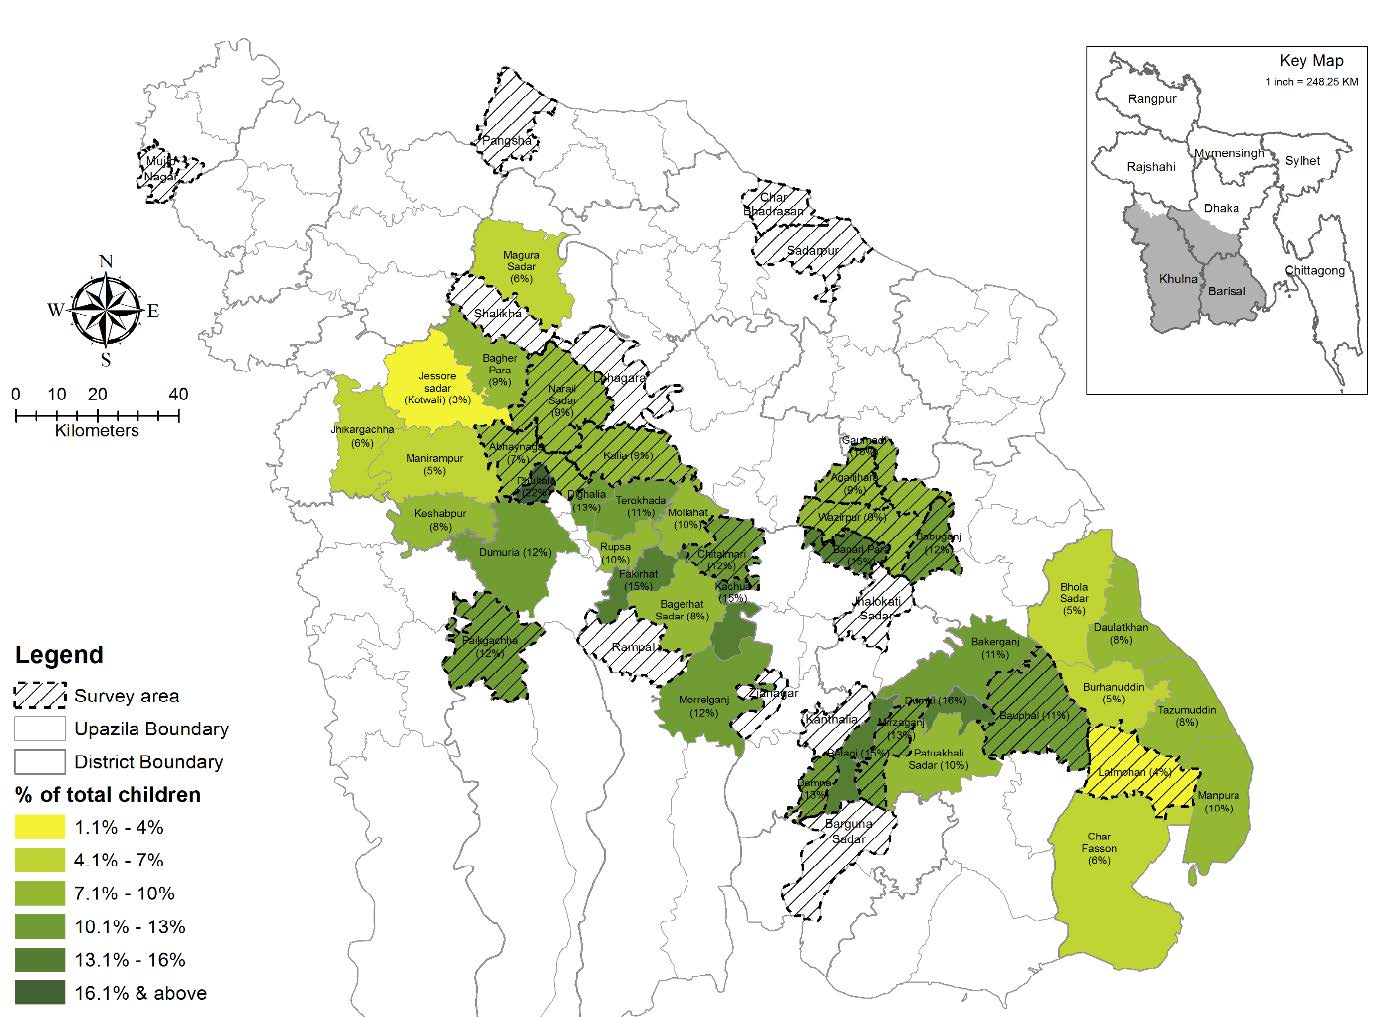
Figure 2 displays the Feed the Future ZOI; the areas included in this assessment are depicted with hatch marks and the SPRING intervention areas are shaded in yellow to green. Hatched areas without color show non-SPRING areas where the survey was conducted. The deepness of the color in each upazila represents the “depth” of the SPRING intervention; to calculate the “depth” of the SPRING intervention in each area, the number of households who participated directly in an FNS course was divided by the number of children in each upazila, based on the 2011 national census. This calculation assumes that the FNS program reached one child under 2 years of age per FNS household. The calculation approximately estimates the percentage of children in each upazila reached by the SPRING intervention: from 4 percent to 22 percent.
Statistical Analysis
For analysis, we limited the sample to the population that most closely matches SPRING’s target group; we included only households with children under 5 years of age, and we limited the analysis to households in the poorest two wealth quintiles in each upazila. To determine the poorest households, we first removed the households without children, then we created a composite wealth index using the new DHS method—combining area-specific indexes into a national model (Rutstein and Johnson 2008).1 We divided this index into five groups in each upazila and time period (baseline/end line) separately; the lowest two wealth quintiles in each upazila were retained for further statistical analysis. See Table 3 for the total number of households and individuals included in the final assessment.
Table 3. Number of Observations for the Populations Included in This Report in Baseline and Endline
| Sample type | Baseline | Endline |
|---|---|---|
| Households | 705 | 466 |
| Child diet (0–23 months) | 282 | 213 |
| Child anthropometry (0–59 months) | 770 | 517 |
| Mothers (14–59 years) | 629 | 439 |
Calculating Sampling Weights
Because the data source varied, the probability weights of each system were not appropriate for this combined analysis, so our analysis weighted the data based on the population of children in each upazila, as recorded in the 2011 Bangladesh census. However, before we applied these weights we standardized the sample size across upazilas, because some upazilas were included multiple times in either the baseline or endline periods. As such, we used the following formula to calculate the weights.
weightupa= | 1 sampleupa | × child populationupa |
Estimating the Counter-Factual
This analysis uses the double difference methods to compare the changes in outcomes, over time, between a population enrolled in a program and a population that is not (i.e., the intervention or treatment group and the comparison group) (Gertler et al. 2011). To apply the difference-in-differences technique, we needed to measure outcomes in the treatment group and the comparison group both before and after the program. If, for example, before and after outcome variables for the treatment group are A and B, and the outcome variables for the comparison group are C and D, respectively. In this case, under the assumption that the trends in the treatment and control groups would have continued the same way as before, in the absence of treatment, we can estimate the treatment effect as: DD = (B − A) − (D – C), where—
| Group | Time | Area |
|---|---|---|
| A | Baseline | SPRING |
| B | Endline | |
| C | Baseline | Other Feed the Future |
| D | Endline |
However, to control for covariates and obtain standard errors, it is beneficial to use a regression framework to further analyze the data. Three different analyses were used in this study, resulting in three different “modified double difference” estimators:
i) Modified double difference for time: We generated a comparison group dummy treatment variable equal to one if a person is in the program, and zero otherwise. We then generated a time dummy variable equal to one for the time period, indicating the post-intervention time, and zero otherwise, and then we did a regression. This equation estimates the extent to which indicators changed, over time, regardless of whether measured in the intervention or comparison group.
ii) Modified double difference for area: We generated a dummy interaction variable that equals one if the analysis unit (suppose a person) is in the treatment group and in the post-treatment time period, and is zero otherwise, and then we did a regression. This equation measures the extent to which variable levels were systematically different between the intervention and comparison areas.
iii) Modified double difference for reach: Finally, we estimated the extent to which coverage by SPRING activities had an impact on nutrition outcomes. For this analysis, we replaced the interaction term of the double difference methodology with a value for “reach” that remains 0 for control areas and for intervention areas at baseline, but takes the value of the percentage of the population under 2 years of age reached at endline for upazilas in the treatment areas2. Therefore, instead of having a value of only 0 or 1, the reach term is a continuous variable that differs across post-intervention area and intensifies with SPRING’s reach in those areas. By doing this, we estimate the impact of the dose of the SPRING intervention (percentage of children reached by SPRING FNS) on each variable of interest. The main findings of this study are general population-level estimates on the SPRING target population, but the modified double differences analyses allow us to estimate whether SPRING had an impact on each variable. This is important because, as mentioned previously, other projects were implemented throughout the Feed the Future zone during the same period as the SPRING implementation.
Data analysis was done using Stata. In this report, the data are described using percentages and means, with significance indicated at 90 percent, 95 percent, and 99 percent levels. For all indicators of interest, the main indicator of impact is the simple double difference estimator. Each indicator has a table that shows the odds ratios for the time, area, and reach estimators for the modified double difference analysis. Estimates were weighted using sampling weights that were constructed based on each household’s probability of selection. All analysis and estimations were performed using the cluster commands in Stata to take into account the sampling design.
Findings
This assessment includes key indicators of household food production, maternal nutrition, IYCF practices, and child nutritional status. As stated in the introduction, our analysis only focused on households with children in the poorest two wealth quintiles. We analyzed all indicators two ways: first, looking at the overall impact of the SPRING intervention compared to other Feed the Future areas (simple double difference estimate); and second, examining the dose effects to measure if SPRING’s impact was greater than the Feed the Future area, in general, where the intervention involved more households. See Table 4 for a general summary of results, with a more detailed analysis later in this report.
Table 4: Summary of SPRING/Bangladesh Difference-in-Difference Results
| Indicator | SPRING Upazilas | Non-SPRING Upazilas | Significance of Simple Double Diff. | ||
|---|---|---|---|---|---|
| Baseline | Endline | Baseline | Endline | ||
| Breastfeeding | |||||
| Food Production | |||||
| Women’s Diet | |||||
| Children’s Diet | |||||
| Food Security | |||||
| Nutritional Status | |||||
| Percentage of children breastfed within the first 24 hours after birth | 34% | 36% | 53% | 36% | * |
| Percentage of children given pre-lacteal feeds | 58% | 33% | 43% | 29% | NS |
| Percentage of children aged 0–5 months who are exclusively breastfed | 39% | 46% | 60% | 40% | NS |
| Percentage of households with homestead gardens with both fruits and vegetables | 53% | 72% | 65% | 66% | ** |
| Percentage of households rearing poultry | 61% | 63% | 62% | 66% | NS |
| Percentage of households with both gardens and poultry | 38% | 49% | 46% | 51% | NS |
| Percentage of women consuming a diverse diet (5+ food groups) | 20% | 24% | 21% | 15% | * |
| Mean women’s dietary diversity score | 3.7 | 3.8 | 3.6 | 3.5 | * |
| Percentage of children aged 6–23 months consuming a diverse diet | 22% | 36% | 33% | 16% | *** |
| Percentage of children aged 6–23 months receiving acceptable feeding frequency | 81% | 86% | 95% | 88% | NS |
| Percentage of children aged 6–23 months receiving a MAD | 22% | 33% | 27% | 16% | ** |
| Percentage of households experiencing food deficits | 43% | 5% | 30% | 4% | NS |
| Percentage of households with poor/borderline/low food consumption | 50% | 20% | 38% | 18% | ** |
| Percentage of children who were stunted | 39% | 33% | 36% | 36% | NS |
| Percentage of children who were severely stunted | 16% | 10% | 7% | 12% | *** |
| Percentage of women with chronic energy deficiency (low BMI <18.5) | 36% | 25% | 28% | 16% | NS |
**p<0.05
***p<0.01
NS = not significant
Household Food Production
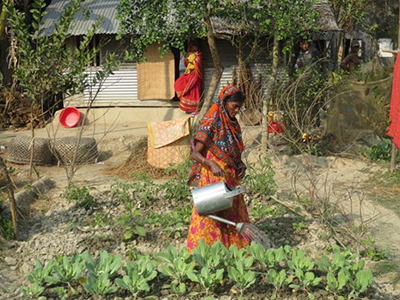
Producing food on the homestead can be an important part of providing better nutrition for women, children, and the whole family. SPRING promoted food production through both FNS and the support provided to government agriculture extension services. Because of limitations in the variables available in our secondary datasets, we cannot explore the differential impact of separate SPRING activities in detail. However, we can examine changes in the percentage of households maintaining vegetable gardens, rearing poultry, and managing both gardens and poultry. A household was categorized as having a vegetable garden if they produced fruits or vegetables for household consumption, or for sale, in the four months before the interview. A household was categorized as rearing poultry if anyone in the household owned any ducks, chicks, or other small avian game at the time of the interview. Note that SPRING also promoted aquaculture interventions, but this was not included in the household food production indicator. Not all intervention areas had access to ponds, and some only had access to shared ponds for fish rearing. Vegetable produce and chickens are available on individual homesteads and do not require access to an additional natural resource. Therefore, for this study, we focused the indicator on these practices. See Figure 3 for the results.
Figure 3. Percentage of Households Practicing Food Production in SPRING and Other Feed the Future Areas
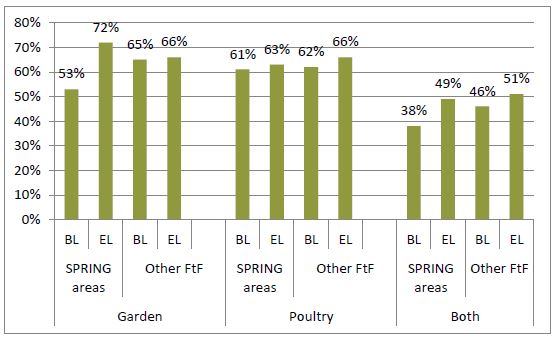
Over time, there were moderate increases in the percentage of households with gardens (left side of figure 3) and the percentage of households with integrated poultry and gardens (right side of figure 3) with only limited increases in the percentage of households with poultry (middle of figure 3). The percentage of households that maintained gardens increased in both SPRING and other Feed the Future areas, but the increase was larger for SPRING areas. The simple double difference estimator was significant (p=0.04), suggesting an overall positive impact of SPRING programs. In contrast, the simple double difference estimator was not significant for poultry rearing (p=0.90) or having an integrated garden with poultry (p=0.48).
Table 5: Assessing Impact of SPRING on Household Food Production
| BothVariables | Gardening (odds ratio) | Poultry (odds ratio) | Both Gardens and Poultry (odds ratio) |
|---|---|---|---|
| Time | 1.42 | 1.53* | 1.58* |
| Area | 0.74 | 1.16 | 0.87 |
| Reach | 1.03 | 0.95* | 0.99 |
<1 = odds are lower with increasing % in total children reached
*p<0.1; **p<0.05; ***p<0.01
Estimates were adjusted for season of assessment and household wealth quintile.
The modified double difference estimates shown in Table 5 suggest a significant effect of time on outcomes (p<0.1), but no significant positive association with SPRING reach. The possibility of a household having poultry, and having both a garden and poultry, increased over time, whether in the treatment or comparison group (second row, p<0.1). The row for “Area” shows that the two groups did not have any significant systematic difference. The “Reach” row shows no significant association between people reached by SPRING and two of the outcomes shown. There was a significant negative association between SPRING reach and raising poultry. More research would be required to explain that negative association but, possibly, the areas where SPRING worked hardest were areas where more families already had poultry.
Developed by the Food and Nutrition Technical Assistance project (FANTA), the Food Deficit Scale, measures serious shortcomings in households' ability to maintain adequate levels of food3 It is created from a subset of questions in Household Food Insecurity Access Scale (HFIAS) module that includes food running out, sleeping hungry, and passing day and night without food; it has been validated for comparing food access across cultures (HKI 2014b). Figure 4, on the left side, shows that, in both SPRING and other Feed the Future areas, a large decline occurred in the percentage of households who had one or more of these severe coping strategies in the month before the interview (food deficit). Despite this encouraging result, because the variable improved in both SPRING and comparison areas by similar margins, the simple double difference estimator was not significant (p=0.57).
Figure 4. Percentage of Households Food Insecure in SPRING and Other Feed the Future Areas
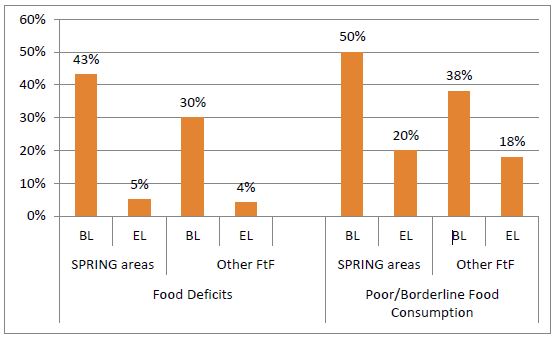
Developed by the World Food Programme (WFP), the food consumption score (FCS) measures households' consumption of diverse foods. For this indicator, respondents were asked how many days in the past week any food item from eight food groups had been prepared and consumed in the household, including staples, pulses, vegetables, fruits, meat/fish/eggs, dairy, oil, and sugar. This indicator includes both food groups with nutritive value, such as vegetables or meat, as well as those with little nutritive value, such as sugar (IFPRI 2008). Figure 4, right side, shows the percentage of households with extremely limited diets, as measured through the WFP FCS methodology. The percentage of households with poor, borderline, or low food consumption declined from nearly half to less than one-fifth households in the SPRING areas, while falling by much less in the other Feed the Future areas. The simple double difference estimator was significant (p=0.03)
Table 6. Assessing Impact of SPRING on Household Food Insecurity
| Variables | Food Deficit Scale (odds ratio) | Poor, Borderline, and Low Food Consumption (odds ratio) |
|---|---|---|
| Time | 0.09*** | 0.33*** |
| Area | 1.9** | 1.55* |
| Reach | 0.95 | 0.98 |
<1 = odds are lower with increasing % in total children reached
*p<0.1 **p<0.05 *** p<0.01
Estimates were adjusted for season of assessment and household wealth quintile. Households were not interviewed about food consumption during the SPRING baseline oversample. Therefore, the upazilas included in that survey are not included in the analysis for these food security indicators, and the FCS analysis was done on 22 upazilas. See Table 1 for more information.
The modified double difference estimates indicate that the odds of having inadequate food availability and consumption decreased significantly from baseline to end line (see the “Time” row, Table 6). The areas where SPRING operated had significantly higher odds of food insecurity than in the other Feed the Future areas (“Area”), demonstrating that SPRING was generally working in areas with higher levels of food insecurity (“Reach”). The percentage of children reached through SPRING interventions (fourth row) was not significantly associated with either of the food security indicators.
Maternal Nutrition
Maternal nutrition is important because it is closely linked to child nutrition and health outcomes; even before pregnancy takes place, women’s nutritional status and micronutrient stores can have a large impact on the health and well-being of her future children. In addition, child and maternal diets are correlated (Amugsi, Mittelmark, and Oduro 2015). In this assessment, we measured both dietary patterns and nutritional status—body mass index (BMI)—of mothers in the survey.
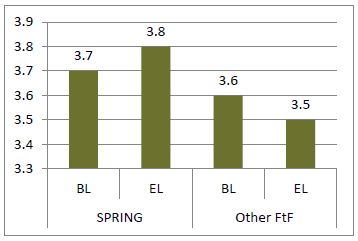
Individual dietary diversity, or the number of food groups eaten by a person in a set period of time, is a proxy measure for both quantity and quality of food consumed, thereby providing an indication of the overall nutrient adequacy of routine dietary intake (Arimond et al. 2009; Swindale and Bilinsky 2006; Ruel, Deitchler, and Arimond 2010; Kennedy, Ballard, and Dop 2011). Dietary diversity was measured using a nine-item scale that has been validated for women in Bangladesh and was developed to ascertain the quality of a woman’s diet based on her nutritional needs4 (Arimond et al. 2009)—starches, dairy products, legumes, dark green leafy vegetables, vitamin A–rich fruits and vegetables, other fruits and vegetables, flesh foods (fish, chicken, beef, etc.), eggs, and organ meats.5 The mean score on this scale increased slightly between the baseline and endline periods in
SPRING areas and declined slightly in the other Feed the Future areas (see Figure 5). The simple double difference estimator was weakly significant (p=0.06).
Figure 5. Average Dietary Diversity Score of Mothers in SPRING and Other Feed the Future Areas
We also measured dietary diversity as the percentage of women consuming at least five out of the nine food groups assessed in the survey (see Figure 6). We used the FANTA-2 cut-off of five or more food groups as indicating a diet with adequate micro- and/or macronutrients (Arimond et al. 2009; Swindale and Bilinsky 2006).6 In line with the change in mean dietary diversity score, it only increased slightly in the SPRING area and declined slightly in the other Feed the Future area (see Figure 6, left side). The simple double difference estimator was significant (p<0.1). In contrast, the consumption of fish increased sharply in both areas (see Figure 6, middle), but with the simple double difference estimator insignificant (p=0.71). Egg consumption doubled in the SPRING upazila while remaining almost the same in the other Feed the Future areas (see Figure 6, right side), but the simple double difference estimator was not quite significant (p=0.10).
Figure 6. Percentage of Mothers with Adequate Dietary Diversity in SPRING and Other Feed the Future Areas (adequate diet, consumption of fish, and consumption of eggs)
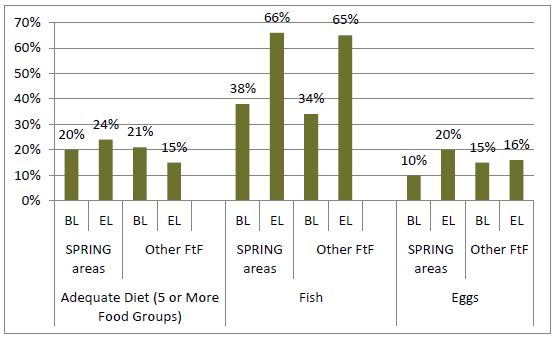
The modified double difference estimates indicate limited impact of time, area, and reach on maternal dietary indicators (see Table 7). Only the odds of eating fish the day before the survey was significantly associated with the time of survey, and no indicator was significantly associated with the areas where SPRING was implemented. Association with the intensity of SPRING reach was only significant for egg consumption. Each percentage increase in the percentage of children reached by SPRING was significantly associated (p<0.1) with a 5 percent increase in the odds of maternal consumption of eggs.
Figure 7. Low Maternal BMI in SPRING and Other Feed the Future Areas
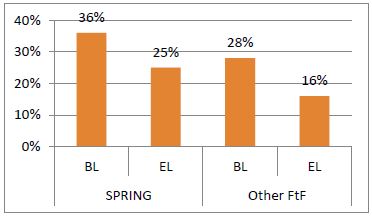
Table 7. Assessing Impact of SPRING on Maternal Dietary Indicators
| EggsVariables | Minimum Dietary Diversity (odds ratio) | Consumption of Fish (odds ratio) | Consumption of Eggs (odds ratio) |
|---|---|---|---|
| Time | 0.84 | 3.25*** | 1.17 |
| Area | 1.11 | 1.1 | 0.69 |
| Reach | 1.03 | 1 | 1.05* |
<1 = odds are lower with increasing % in total children reached
*p<0.1 **p<0.05 ***p<0.01
Estimates were adjusted for season of assessment, age of mother, and household wealth quintile.
The nutritional status of mothers was calculated using the BMI (WHO 2008). Having a BMI under 18.5 is classified as low BMI. The percentage of mothers who were underweight decreased in both the SPRING and comparison areas, but the decline was slightly larger in the non-SPRING areas. The simple double difference estimator was insignificant (p=0.53). Also, the modified double difference estimates did not show any evidence of significant impact of SPRING activities on low maternal BMI.
Infant and Young Child Feeding Practices
This assessment uses the standardized World Health Organization (WHO) indicators of IYCF practices to measure child feeding. All indicators, except early initiation to breastfeeding, are based on feeding practices the day before the interview (WHO 2008; WHO 2010). If the respondent could not answer a question, it was excluded from the analysis.
Early and Exclusive Breastfeeding
The Lancet estimated that 12 percent of all deaths of children under the age of 5 could be prevented through universal coverage of appropriate breastfeeding (Black et al. 2013). Breastfeeding behaviors in this assessment include early initiation of breastfeeding, pre-lacteal feeding, and exclusive breastfeeding during the first six months of life. The percentage of children who had an early initiation to breastfeeding increased slightly (not significantly) in SPRING areas, but declined substantially (not significantly) in the comparison areas (see Figure 8). The simple double difference estimator was weakly significant (p=0.08).Pre-lacteal feeding fell in both the SPRING working areas and the other areas of the Feed the Future zone, but the reduction was larger and statistically significant in the SPRING areas. The simple double difference estimator was insignificant (p=0.42).
The percentage of infants exclusively breastfed increased slightly in SPRING areas and declined in the other Feed the Future areas. The simple double difference estimator was large (OR 6.6), but not significant (p>0.13).
Figure 8. Early Breastfeeding Behaviors in SPRING and Other Feed the Future Areas
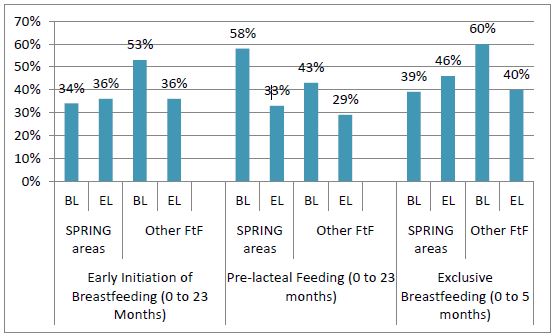
Table 8. Assessing Impact of SPRING on Early Breastfeeding Indicators
| Variables | Early Initiation to Breastfeeding (odds ratio) | Pre-lacteal Feeding (odds ratio) | Exclusive Breastfeeding (odds ratio) |
|---|---|---|---|
| Time | 0.63 | 0.69 | 0.33 |
| Area | 0.54** | 2.21** | 0.31 |
| Reach | 1.04 | 0.93** | 1.13 |
<1 = odds are lower with increasing % in total children reached
* p<0.1 ** p<0.05 *** p<0.01
Estimates were adjusted for child age and sex, season of assessment, and household wealth quintile.
The modified double difference estimates indicate that the odds of all indicators were not associated with the time of the survey (see Table 8). The SPRING selected area, on average, had significantly lower rates of early initiation and higher rates of pre-lacteal feeding at baseline (columns 1 and 2), again suggesting that SPRING was working in less advantaged areas within the Feed the Future zone. SPRING’s reach had a significant (p<0.05) impact on pre-lacteal feeding, but not on the other two indicators. For each percentage increase in children reached by SPRING, the odds of the pre-lacteal feeding declined by 7 percent.
Children’s Dietary Diversity, Feeding Frequency, and Minimum Acceptable Diet
The WHO standardized IYCF questionnaire and indicators (WHO 2008; 2010) was used to measure dietary quality for children ages 6–23 months. We used a seven-item scale, including starches, legumes and nuts, dairy products, flesh foods, eggs, vitamin A–rich fruits and vegetables, and other fruits and vegetables. Based on consumption of these food groups during the previous 24 hours and the number of times a child was fed, we measured the dietary diversity and feeding frequency, and based on those, the MAD (see Figure 9). The percentage of children with minimum dietary diversity (i.e., child eating from a minimum of four food groups out of the seven food group scale) increased in SPRING areas, while it fell slightly in the other Feed the Future areas. The simple double difference estimator was large (OR 5.4) and significant (p<0.01).
A proxy indicator for the amount of food fed is the minimum feeding frequency, which requires that breastfed children between 6 to 8 months are fed semi-solid food at least twice per day and children ages 9 or more months are fed at least three times (non-breastfed children should be fed at least four times per day, including milk feeds) (HKI 2014b). This indicator had little change, but most children were fed in line using this guideline. Over time, this indicator increased slightly in the SPRING areas, but declined slightly in the other Feed the Future areas. Because the changes were relatively small, the simple double difference estimator was insignificant (p=0.15).
Minimum acceptable diet combines these two measures of dietary diversity and feeding frequency. Breastfed children ages 6 to 23 months are classified as having a MAD if they meet the criteria for minimum dietary diversity and minimum meal frequency, while non-breastfed children have to meet these two indicators and have minimally adequate feedings of milk products. Similar to the other two indicators, MAD increased in the SPRING areas between baseline and endline and declined in the other Feed the Future areas. The simple double difference estimator was significant (p=0.03). This change was primarily driven by increased dietary diversity.
Figure 9. Complementary Feeding of Older Infants and Younger Children (6–23 months) in SPRING and Other Feed the Future Areas
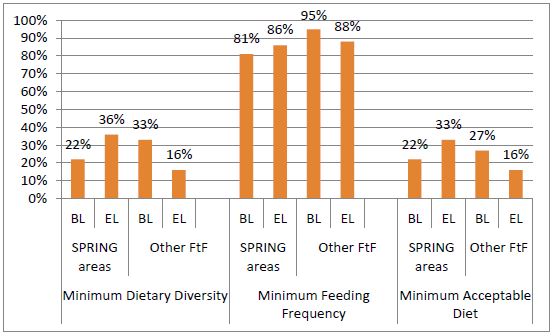
Table 9. Assessing Impact of SPRING on Complementary Feeding Indicators
| Variables | Minimum Dietary Diversity (odds ratio) | Minimum Feeding Frequency (odds ratio) | Minimum Acceptable Diet (odds ratio) |
|---|---|---|---|
| Time | 0.44** | 0.24* | 0.53 |
| Area | 0.67 | 0.14** | 0.82 |
| Reach | 1.14*** | 1.22** | 1.11*** |
<1 = odds are lower with increasing % in total children reached
* p<0.1 ** p<0.05 *** p<0.01
Estimates were adjusted for child age and sex, season of assessment, and household wealth quintile.
The modified double difference estimates (see Table 9) indicate that the odds of obtaining minimum dietary diversity, minimum feeding frequency, and MAD were all negatively associated with time (OR<1), but the association with MAD was not significant. While SPRING saw improvements in our areas, the negative association with time can be explained by the whole sample. SPRING worked in areas that were lower at baseline than the other Feed the Future areas, so small improvements could still be seen within the overall negative association. All three indicators were negatively associated with being in the SPRING working areas (lower levels at baseline), but only minimum feeding frequency was significant. In contrast, all three indicators were positively and strongly significantly associated with SPRING reach. Each percentage point increase in reach was associated with a 14 percent increase in the odds of a child obtaining a minimally diverse diet, a 22 percent increase in the odds of a child obtaining a minimal dietary frequency, and an 11 percent increase in the odds of children obtaining a minimally adequate diet for each percentage point increase in reach. In summary, these results indicate that SPRING had both a general impact on these IYCF indicators and a larger impact where the program’s reach was more intensive.
Child Nutritional Status
Shortcomings in child care, health, and feeding contribute directly to a child’s undernutrition (UNICEF 2015). The Lancet Maternal and Child Nutrition Series estimated that, on an aggregate level, undernutrition is an underlying cause of 3.1 million child deaths annually (Black et al. 2013). In this section, we observe the trend of stunting—low length or height attainment for age—which is caused by chronic shortcomings in child nutrition and health.
The percentage of children who were stunted declined in SPRING areas from 39 percent to 33 percent, while remaining the same (36 percent) in the other Feed the Future areas (see Figure 10). Severe stunting had an especially large change, where the percentage of severely stunted children decreased in SPRING areas from 16 percent to 10 percent, but increased in the other Feed the Future areas. The simple double difference estimators were insignificant for overall stunting (p=0.37) but highly significant for severe stunting (p<0.01). This suggests that, in the aggregate, SPRING helped reduce the level of severe stunting in the areas where the project worked.
Figure 10. Percentage of Children Stunted and Severely Stunted in SPRING and Other Feed the Future Areas
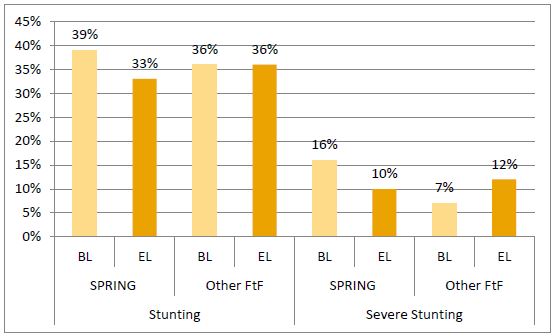
Table 10. Assessing Impact of SPRING on Child Nutritional Status
| Variables | Stunting (total) (odds ratio) | Severe Stunting (odds ratio) |
|---|---|---|
| Time | 1.07 | 1.88* |
| Area | 1.21 | 2.55*** |
| Reach | 0.97 | 0.9*** |
<1 = odds are lower with increasing % in total children reached
* p<0.1 ** p<0.05 *** p<0.01
Estimates were adjusted for child age and sex, season of assessment, and household wealth quintile.
Table 10 shows the modified double difference estimates for stunting and severe stunting. None of the three variables showed significant total stunting (mild plus moderate plus severe), but all were associated with severe stunting. The odds of being severely stunted (column 3) were marginally higher at the time of the endline and significantly higher in the SPRING working areas. This suggests that the SPRING intervention had an impact on severe stunting. Each percentage increase in the percentage of children covered by SPRING was associated with a 10 percent reduction in the odds of a child being severely stunted.
Discussion
We showed that a comprehensive multi-sectoral, multi-channel integrated approach to nutrition can lead to behavior changes and impact nutritional status when implemented at scale. This study found evidence that SPRING’s package of interventions implemented across the health, agriculture, and water, sanitation, and hygiene (WASH) sectors, led to positive impact being observed on several nutrition outcomes at the population level, including reduced stunting and optimal nutrition, and dietary practices. From 2012–2017, the SPRING project used SBCC to promote healthy nutrition practices within the areas of IYCF, women’s nutrition, nutrition-sensitive agriculture, and WASH—keeping the compound clean of animal feces and promoting good hand hygiene. Our hypothesis was that nutrition interventions will be successful and sustainable if they address multifaceted determinants of nutrition, through a variety of influencing sectors, and not focus on only one aspect of nutrition. Further, the SBCC approach increases the likelihood of achieving behavior change by using repeated messages on small, doable actions that beneficiaries would hear multiple times through different channels. This study used the existing data sets to determine whether the approach by SPRING had a greater impact on nutritional outcomes and behaviors in project areas compared to other areas where SPRING was not working. Most of the data come from surveys carried out by the FSNSP and a separate USAID-funded Feed the Future monitoring system, which was a follow-on to FSNSP from 2013 to 2016 that used similar design and sampling frame. Nevertheless, other organizations were implementing interventions in other areas of the Feed the Future ZOI. In that sense, the results estimate the “value-added” of SPRING’s approach compared to other, more single-focused approaches. We could not determine the exact activities of other interventions.
SPRING’s impact and intensity—expanded reach of percentage of children—were seen more on indicators related to food, especially household gardens, children’s dietary diversity, food insecurity, and nutritional status of severe stunting, with smaller impacts on maternal diets and breastfeeding. SPRING areas had a greater impact on the percentage of households that maintained gardens (53 percent to 72 percent) compared to other areas of the Feed the Future ZOI (65 percent to 66 percent). Interestingly, however, this was not associated with higher coverage by SPRING interventions (modified double difference for reach was not significant). The strong increase in the percentage of households with gardens in SPRING areas may, therefore, have been driven by SPRING processes that included both the direct intervention of FNS, the engagement of the MOA and their outreach to the entire upazila, including the spillover effect (to neighboring communities) of improved agriculture techniques that SPRING documented elsewhere (SPRING 2017).
Related to the increased prevalence of household gardens, particularly in SPRING areas, food security improved markedly in both SPRING and non-SPRING upazilas. In SPRING upazilas, the percentage of households reporting food insecurity, as measured by FANTA’s Food Deficit Scale (Ballard et al. 2011), declined from 43 percent at baseline to 5 percent at endline, nearly matched by the decline in non-SPRING upazilas from 30 percent to 4 percent, even though the percentage of homestead gardens in non-SPRING areas remained the same (66 percent). Further, while the improvements in both SPRING and non-SPRING areas are noteworthy and welcome, the food security measures do not indicate if the food is nutritious or diverse. One of the key innovations of SPRING’s approach is the effort to go beyond food security and promote consumption of more nutritious and diverse foods. To fully achieve that, traditional agriculture programs will probably not be sufficient unless complemented with more integrated nutrition education and promotion of diverse diets and locally available, nutrient-dense foods, thereby ensuring that agricultural interventions are nutrition-sensitive.
Children’s dietary diversity increased significantly between baseline and endline—from 22 percent to 36 percent (p<0.01)—and MAD increased from 22 percent to 33 percent (p<0.01), while these measures declined in non-SPRING Feed the Future areas. Further, the impact in SPRING upazilas was greater in those areas with more intensive SPRING coverage. The modified double difference estimator for reach was significant for child dietary diversity and MAD (p<0.01), and child feeding frequency (p<0.05).
Although the effects on women’s dietary diversity were also positive, they were weaker than the effects on children’s dietary. The percentage of women consuming five or more food groups improved slightly in SPRING areas from 20 to 25 percent, while falling slightly in other Feed the Future areas from 21 to 15 percent. The simple double difference estimator was not quite significant (p=0.07). It should be noted that although the changes in dietary diversity were greater in children than mothers, both rates moved in the same direction in both areas, either both up or both down. Their co-movement is consistent with reports elsewhere, indicating the important relationship between maternal and child dietary diversity (Amugusi et al. 2015). The influence on a mother’s dietary diversity will be reflected in her child’s dietary diversity.
Some breastfeeding outcomes were positively associated with SPRING areas, but they were not as strong as the feeding indicators. Early initiation of breastfeeding was significant (p<0.1). The simple differences in the percentage of children receiving pre-lacteal feedings was not significant, but the modified double difference showed a significant impact with intensity (p<0.05). Encouragingly, the prevalence of pre-lacteal feeding was much lower at endline than at baseline in both SPRING and non-SPRING areas. In SPRING areas, pre-lacteal feeding declined from 58 percent to 33 percent, which impacts exclusive breastfeeding rates. The percentage of children who were exclusively breastfed increased substantially in SPRING areas (39 percent to 46 percent), while declining steeply in non-SPRING areas (60 percent to 40 percent), although the differences were not significant. The 2014 Bangladesh DHS (NIPORT 2016) showed a decline in exclusive breastfeeding throughout the country between 2011 and 2014. Even though it was not statistically significant, the increases in exclusive breastfeeding seen in the SPRING upazilas reveal that the SPRING approach may have helped protect and promote breastfeeding while rates were declining elsewhere.
The overall goal of SPRING in Bangladesh was to reduce stunting among children under 2 years of age. The indicators measured through this assessment, and discussed above, are known to contribute to stunting, either directly or indirectly (HKI 2014b, Black et al. 2013). Encouragingly, the assessment found that stunting declined significantly in SPRING-supported upazilas from 39 percent to 33 percent between baseline and endline, while remaining unchanged at 36 percent in other Feed the Future areas. More striking, severe stunting declined from 16 percent to 10 percent in SPRING areas, and actually increased from 7 percent to 12 percent in those areas not supported by SPRING. The simple double difference and modified (reach) double difference estimators were both significant (p<0.01), suggesting that the improvements were even greater in those SPRING upazilas where the project had wider coverage of children. This could be because the engagement of the health authorities who not only extended nutrition information, but strengthened the quality of nutrition services to better identify and treat severe malnutrition. Mild to moderate malnutrition is often missed when it’s widespread and common. Therefore, they will require the sustainability of nutrition prevention and promotion to reach future children with optimal practices.
Overall, this impact assessment suggests that the full package of SPRING interventions had positive effects on behaviors at the household and individual levels. Most of the indicators improved more in SPRING-supported areas between baseline and endline than in non-SPRING areas; and where they did not improve more, it was usually because the indicators improved in both SPRING and non-SPRING upazilas. This is, therefore, an overall positive result for Feed the Future programming and for Bangladesh.
Results from this assessment suggest that implementing a full package of nutrition interventions across the health, agriculture, and WASH sectors can have a positive impact on a range of nutrition outcomes at the population level, ultimately leading to reduced stunting. The results suggest that SPRING’s added value of using a multi-faceted approach, including homestead food production, essential nutritional and hygiene education actions, leveraging government through multiple ministries, and repeating messages over multiple channels on small, doable actions, had a positive impact. One possible explanation for why the SPRING approach was successful could be SPRING’s comparative advantage of targeting the 1,000 days, reaching vulnerable children through behavior change communication and training of mothers, engaging family influencers (fathers and grandmothers were welcome to participate in FNS), and empowering women to become leaders in their communities to continue sharing key messages and practices with their neighbors. While most other Feed the Future programs focus on market and agricultural interventions that did not target 1,000 day families nor integrate dietary needs into the types of foods to be grown.
This assessment was limited by our dependence on a secondary dataset (FSNSP), whose sampling and overall methodology was not specifically designed as an impact evaluation of SPRING. The FSNSP selected upazilas to achieve representative results in the overall Feed the Future ZOI, but SPRING’s selection of upazilas for this study was simply to use all 26 that were sampled by FSNSP during both the baseline and endline periods. This limited the sample size and power of the study to detect change. SPRING was implemented in areas with comparatively worse food and nutrition security, which could have diluted the impact relative to the comparison with other Feed the Future areas. On the other hand, the fact that the initial selection of upazilas by FSNSP was randomized reduces the potential for bias. Further, our counterfactual identification strategy using the depth of the SPRING intervention among SPRING upazilas helped us to tease out the project’s impact, in addition to changes from other programs being carried out in the Feed the Future ZOI.
Observed impact was also likely tempered because the surveys analyzed were population-based, so the degree of impact observed depended not only on behavior change among respondents, but also on the percentage of the population reached with SPRING interventions. In other words, measuring the impact on people reached by SPRING was diluted by a greater or lesser degree, depending on what percentage of the total population was reached by the project in that area. Therefore, it is possible that SPRING successfully influenced a number of behaviors that were not found to change significantly in this study, because it did not reach enough people to achieve significant change at the population level. Remember, reach was measured by the percentage of children, not households or women. And, households have multiple children under 5 years of age. Other studies carried out by SPRING, which looked specifically at beneficiaries, showed substantially stronger results, particularly around women’s dietary diversity and hygiene; we did not see that at the population level in this study (Black et al. 2008; BBS 2013).
In summary, the impact of SPRING’s programming kept pace with overall trends seen in the Feed the Future ZOI, while outperforming the comparison areas in several outcomes, especially gardening, child feeding (particularly diet diversity and MAD), and reduction in severe stunting. SPRING’s multi-sectoral focus on building capacity for both governmental and household actors, and the project’s use of repeated messages on doable actions through multiple channels, were likely drivers of the improvements observed in this study, and could potentially lead to further improvements in nutrition outcomes if continued at scale into the future.
Footnotes
1 This wealth index was constructed using the same methodology that the Demographic and Health Survey system has used from 2010 (Rutstein and Johnson 2008) and not the methodology used in past FSNSP reports. This index was derived separately for rural areas, municipalities, and city corporations, before being combined with nationally relevant indicators.
2 Reach is defined as the percentage of children (and by association their mothers) that come in contact with SPRING programs, based on SPRING monitoring records and census data.
3 This measure is identical to the Household Hunger Score. In Bangladesh, the word hunger means a famine condition, and does not accurately reflect the commonly reported items included in this indicator. For more information, see the HKI 2011 report.
4 The nine-item scale was used rather than the currently recommended 10-item scale because the baseline data was collected before the new recommendations were made public. Using the nine-item scale allowed for comparability between baseline and endline.
5 This was the most internationally standardized indicator for dietary diversity at the time of baseline.
6 Though these cut-offs have only been evaluated for non-pregnant and non-lactating married women over 15 years of age, our analysis applies this methodology to pregnant and lactating women.
References
Amugsi, Dickson, Maurice Mittelmark, and Abraham Oduro. 2015. “Association between Maternal and Child Dietary Diversity: An Analysis of the Ghana Demographic and Health Survey.” San Francisco: PLoS ONE 10(8): e0136748. doi:10.1371/journal.pone.0136748.
Arimond, Mary, Liv Elin Torheim, Doris Wiesmann, Maria Joseph, and Alicia Carriquiry. 2009. Dietary Diversity as a Measure of the Micronutrient Adequacy of Women's Diets: Results from Rural Bangladesh Site. Washington, DC: Food and Nutrition Technical Assistance Project (FANTA), Academy for Educational Development.
Ballard, Terri, Jennifer Coates, Anne Swindale, and Megan Deitchler. 2011. Household Hunger Scale: Indicator Definition and Measurement Guide. Washington, DC: Food and Nutrition Technical Assistance II Project, FHI 360.
Bangladesh Bureau of Statistics (BBS). 2013. Population Census 2011. Community Series. Dhaka: BBS.
Black, R. E., et al. 2008. “Maternal and child undernutrition: Global and regional exposures and health consequences.” The Lancet, vol. 371 (9608): 243–260.
Black, R. E., et al. 2013. “Maternal and child undernutrition and overweight in low-income and middle-income countries.” The Lancet, vol. 382 (9890): 427–451.
Food and Agriculture Organization of the United Nations (FAO). 2016. FARMER FIELD SCHOOL GUIDANCE DOCUMENT: Planning for quality programmes. Rome: FAO. http://www.fao.org/documents/card/en/c/d7d4db1f-826f-4d81-b097-44292ff7eeca/
Food Security and Nutrition Network. 2015. Understanding the Essential Nutrition Actions and Essential Hygiene Actions Framework. Washington, DC: FSN Network 2015. https://www.fsnnetwork.org/essential-nutrition-actions-and-essential-hygiene-actions-framework
Gertler, Paul J., Sebastian Martinez, Patrick Premand, Laura B. Rawlings, and Christel M. J. Vermeersch. 2011. Impact Evaluation in Practice. Washington, DC: The International Bank for Reconstruction and Development/The World Bank.
Guyon A. B., V. J. Quinn, M. Hainsworth, P. Ravonimanantsoa, V. Ravelojoana, Z. Rambeloson, and L. Martin. 2009. “Implementing an integrated nutrition package at large scale in Madagascar: The Essential Nutrition Actions Framework.” Food Nutr Bull 2009;30: 233–44.
Helen Keller International (HKI). 2014a. “Helping Families Grow Better Food.” HKI: http://www.hki.org/our-work/improving-nutrition/helping-families-grow-better-food#.WmVoerenHIW
Helen Keller International (HKI) and James P. Grant School of Public Health (JPGSPH.) 2014b. State of Food Security and Nutrition in Bangladesh: 2012. Dhaka: HKI and JPGSPH.
International Food Policy Research Institute (IFPRI). 2008. Validation of food frequency and dietary diversity as proxy indicators of household food security. Rome: World Food Programme.
Kennedy, Gina, Terri Ballard, and MarieClaude Dop. 2011. Guidelines for measuring household and individual dietary diversity. Nutrition and Consumer Protection Division. Rome: Food and Agriculture Organization of the United Nations.
National Institute of Population Research and Training (NIPORT), Mitra and Associates, and ICF International. 2016. Bangladesh Demographic and Health Survey 2014. Dhaka, Bangladesh, and Rockville, Maryland, USA: NIPORT, Mitra and Associates, and ICF International.
Ruel, Marie T., Megan Deitchler, and Mary Arimond. 2010. “Developing Simple Measures of Women's Diet Quality in Developing Countries: Overview.” The Journal of Nutrition, Vol. 140, Issue 11.
Rutstein, Shea O., and Kiersten Johnson. 2008. The DHS Wealth Index: Approaches for Rural and Urban Areas. Calverton, MD: ORC Macro.
SPRING. 2017. Bangladesh: Spillover Effect of Farmer Nutrition Schools among Non-Project Beneficiaries. Arlington, VA: Strengthening Partnerships, Results, and Innovations in Nutrition Globally (SPRING) project.
Statistics Division, Department of Economic and Social Affairs, United Nations Secretariat. 2005. Designing household survey samples: Practical guidelines. New York: United Nations, Vol. Series F, No. 98.
Swindale, Anne, and Paula Bilinsky. 2006. Household Dietary Diversity Score (HDDS) for Measurement of Household Food Access: Indicator Guide, Version 2. Washington, D.C.: Food and Nutrition Technical Assistance Project (FANTA), Academy for Educational Development.
United Nations Children’s Fund (UNICEF). 2015. UNICEF Framework. New York: UNICEF. https://www.unicef.org/nutrition/files/Unicef_Nutrition_Strategy.pdf
World Health Organization (WHO). 2008. Indicators for assessing infant and young child feeding practices. Part 1: Definitions. Geneva: WHO.
World Health Organziation (WHO). 2010. Indicators for assessing infant and young child feeding practices. Part 2: Measurement. Geneva: WHO.
