A Road Map to Scaling Up Maize Flour Fortification
Executive Summary
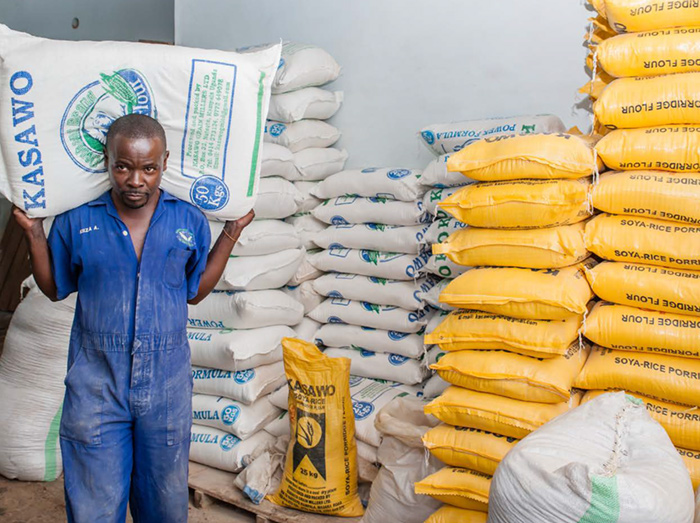
Mapping the maize millers was a nationwide exercise. The National Working Group on Food Fortification (NWGFF) approved the activity, which aimed to inform stakeholders about the status of the maize milling industry in Uganda. This exercise resulted from the learning exchange visit to the Sanku project site in Tanzania and aimed to establish baseline information on maize flour processing and the status of maize flour fortification in Uganda.
The survey took place in the four major regions of the country: central, eastern, western, and northern. It reached 780 maize millers from 62 districts. Survey results indicated the central region has the highest percentage of maize millers (38 percent), followed by the eastern (22 percent), and the northern (22 percent). The western region has the lowest percentage of maize millers (18 percent). Most maize millers (46.3 percent) have a production capacity of 1–5 metric tons (MTs) per day.
Across all regions, reliable availability of electricity was the biggest challenge faced by maize millers. In addition, most of the maize millers in Uganda exhibited at least one poor manufacturing practice (relating to infrastructure, sanitation, or availability of storage facilities of raw materials and finished products).
At the time of the survey, results showed that only 0.5 percent (4 maize millers out of 780) were actively fortifying their products. While the survey also found that 1.8 percent of the millers (14 out of 780) have installed food fortification equipment, most of these have not yet adopted the practice of fortifying.
A number of recommendations have stemmed from these findings:
- to support maize millers who installed equipment to calibrate their dossiers in order to start fortification,
- to sensitize the millers on the use of food grade equipment,
- to increase public awareness on the benefits of consuming fortified foods, and,
- to explore feasible technologies to scale up maize flour fortification.
Finally, maize millers in all regions asked for reduced electricity tariffs and improved power quality.
1. Background
The Government of Uganda has made considerable progress in advancing the food fortification agenda and developing food quality control systems, including passing the mandatory food fortification regulations for wheat and maize flour, edible oil, and fats. These efforts are to improve the quality of foods and reduce micronutrient deficiencies.
A multi-sectoral National Working Group on Food Fortification (NWGFF) was established to support government efforts and to oversee the food fortification program. Uganda has made significant progress in fortifying edible oils/fats, wheat flour, and salt; however, fortification of maize flour remains a challenge. The maize-milling sector is dominated by millers whose production capacity is less than 20 MTs/day, the capacity specified in the mandatory fortification policy—therefore, most of the flour sent out to the market is not fortified.
The 2015 Fortification Assessment Coverage Tool (FACT), a survey conducted by the Ministry of Health and Makerere University with support from the Global Alliance for Improved Nutrition (GAIN), found that 92 percent of households in Uganda consume maize flour, 42 percent of which is considered "fortifiable" (food not made at home and assumed to be industry made). However, only 6.5 percent of households in Uganda consume fortified maize flour (GAIN n.d.). The study also indicated that fortification was technically possible in the country; however, more effort was needed to organize the industries and to monitor and regulate the program.
The NWGFF recognized the need to scale up maize flour fortification, prompting the suggestion to conduct a learning site visit to the Tanzania Sanku project, which has successfully implemented targeted maize flour fortification for small- and medium-scale maize millers using appropriate and sustainable technology. After this exchange visit, a key recommendation from the NWGFF was to map the maize millers and identify the number and scale of millers in Uganda.
General objectives of the mapping exercise
To establish baseline information on maize flour processing and the status of maize flour fortification in the different regions of Uganda.
1.1 Specific objectives
- To obtain information on the distribution of maize millers in the different regions.
- To obtain data on the production capacity of maize millers and their target markets in the different regions.
- To generate data on the good manufacturing practices (GMP) of maize millers in the different regions.
- To obtain data on the status of maize flour fortification in the different regions of Uganda.
- To identify common challenges experienced by maize millers from the different regions of Uganda.
1.2 Scope
SPRING/Uganda conducted the survey in the four major regions of Uganda: central, eastern, western, and northern. It reached 780 maize millers from 62 districts. SPRING/Uganda sampled 16 districts in each of the central, eastern, and western regions, and 14 districts in the northern region. Out of 874 maize millers contacted, 780 agreed to participate (89 percent response rate).
1.3 Limitations
- An extensive sampling of maize millers was taken, however, some areas in certain districts may not have been captured.
- The exercise does not clearly distinguish between small- and medium-scale maize millers, but rather gives ranges for production capacities.
- The percentages of maize millers reported represent only maize mills that were operational at the time of the study and, therefore, excluded any mill(s) that were not operating during this time.
- The figures represented per region indicate maize millers who accepted and consented to share data with the research team; therefore, this excludes any data for millers who did not consent.
- Some results were expressed as counts, rather than percentages, and may not be statically significant to represent a whole region.
- We did not use a geographical information system (GIS), which could have provided more accurate data on the geographic location of all the mapped millers.
1.4 Definition of terms
factors of production: Resources or inputs that directly or indirectly influence the production process when maize flour is produced.
food fortification: The addition of key vitamin and minerals (e.g., iron, folic acid, iodine, vitamin A, and zinc) to staple foods to improve the nutritional content and address nutritional gaps in a population.
fortification equipment: Any machinery used to add vitamins and minerals at the industry.
good manufacturing practice (GMP): The practices required to conform to the guidelines recommended by agencies that control food safety and quality.
- infrastructure status (whether constructed or not)
- sanitation status (general observed levels of cleanliness of the environment and waste disposal)
- availability of storage facilities of raw materials and finished products.
hammer mill: A mill whose purpose is to shred or crush aggregate maize grains into fine particles using the repeated blows of little hammers.
horsepower (HP): A unit to measure the power of engines and motors.
huller: A motor-powered machine that removes the outer covering of maize (commonly known as bran) before the actual milling of the maize flour.
metric ton (MT): A unit of weight equal to 1,000 kilograms (kg).
mill: A motor-powered machine that grinds dehulled maize particles into fine maize flour.
motor: A device that converts electrical or other energy into mechanical energy to initiate motion.
non-food grade equipment: Equipment that should not be directly or indirectly in contact with foods; if they are combined, the food may be contaminated or poisoned, making it unsafe for human consumption.
production capacity: Refers to the quantity of maize flour (calculated in MTs) produced in a specific period.
roller mill: A mill with cylindrical rollers, either in opposing pairs or against flat plates, that crushes or grinds maize grains into fine particles.
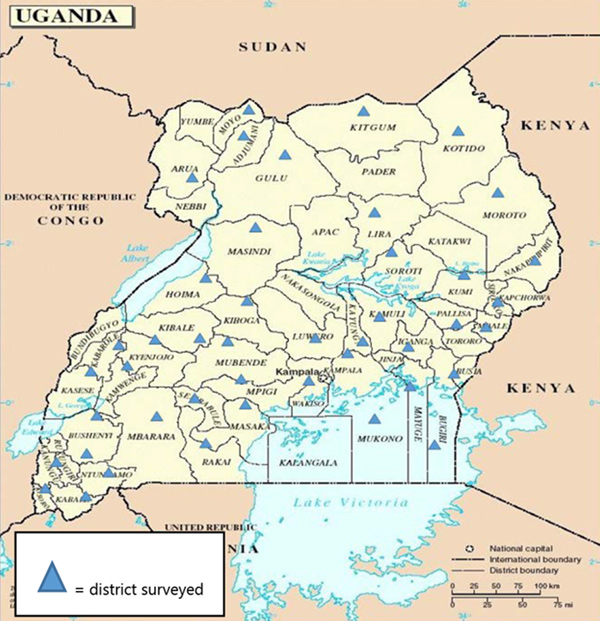
Figure 1: Map of Uganda
2. Methodology
2.1 Team composition
The Ministry of Trade Industry and Cooperatives (MTIC) and the Private Sector Foundation of Uganda (PSFU) led the data collection team. Other members included the Ministry of Health, Grain Council of Uganda (GCU), District Health Inspectors, District Nutrition Coordination Committee members, maize millers, and SPRING/Uganda.
2.2 Study design
The study used a cross-sectional design, including both quantitative and qualitative methods. The survey was conducted in 62 districts in four regions of Uganda: northern, eastern, western, and central. Figure 1 is a map of Uganda, including the districts in the survey.
2.3 Data collection tools
Team members used semi-structured questionnaires and observational checklists for data collection. The tools capture specific indicators outlined in the specific objectives. Tools were further pre-tested and validated prior to field data collection. A pretested structured questionnaire was used to conduct individual interviews with maize millers.
2.4 Sampling criteria
The districts to be surveyed were selected with guidance from the GCU, taking into account the districts with the highest maize production and consumption.
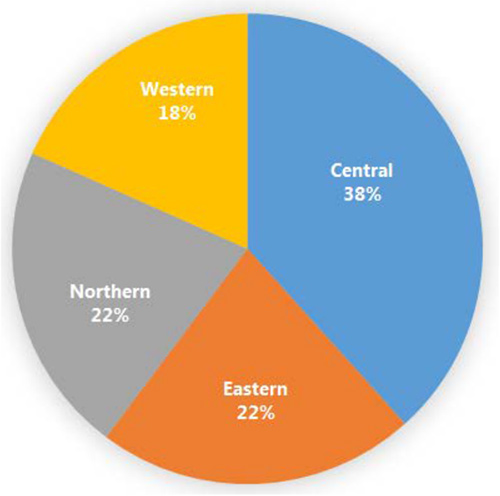
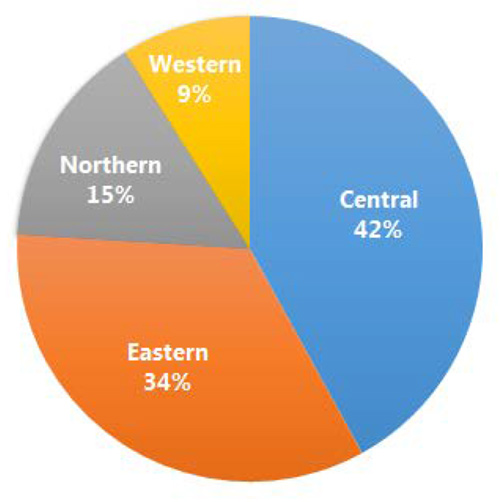
Figure 2: Percentage of Maize Millers, by Region
In each region, maize millers nominated a focal person to represent them on issues related to maize flour processing. During the survey, miller focal persons also served as points of contact to reach the larger group of millers and identified other maize millers from different locations.
2.5 Ethical considerations
For engagement at the district, the MITC issued an official introductory letter to the production offices at the different districts where data were collected. In each district, lists of maize millers were drawn up with the help of local councils, sub-county production staff, and miller focal persons. Prior to the data collection, all respondents who participated in the survey gave their written consent.
3. Findings
3.1 Distribution of maize millers in regions of Uganda
According to the survey, maize flour in Uganda is produced in all four regions of the country; the central region is the leading producer, followed by the eastern, northern, and western regions, respectively (see figure 2).
Of the four regions, the central region has the largest number of maize flour producers (38 percent of millers), followed by the eastern and northern regions (22 percent in each), and lastly, the western region (18 percent).
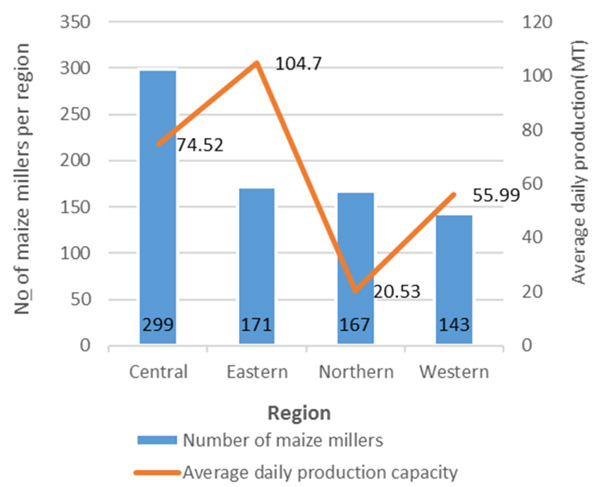
Figure 3: Number of Maize Millers and Their Average Production Capacities, by Region
The distribution of maize millers in figure 2 only represents the mills that were operational during data collection. Some millers across the country have been driven out of business by factors of production within the regions, including electricity shortages and market-related challenges.
The central region had the largest number of maize millers (299), followed by the eastern region (171), then the northern region (167), and lastly the western region (143). The finding could be influenced by several factors, including market availability, labour, social-cultural practices, or working capital.
3.1.1. Production capacity of maize millers
As seen in figure 3, the eastern region had the highest average daily production capacity (104 MT) of maize flour, followed by the central region (74.52 MT), western region (55.99 MT), and the northern region (20.53 MT). The eastern region’s higher production capacity could be because it has space available for expansion, labour, and availability of maize grains, among other factors. The low average daily production in the northern region could be because the majority of maize millers operate on a small scale, mainly using simple diesel machines, characterized by low output.
Although the central region has the largest number of maize millers, the average daily production capacity is slightly lower than in the eastern region. This could be because of the limited space for expansion of business, especially in the urban and semi-urban areas; labour shortages; diversity of other foods; and other factors. The relatively low average daily production capacity of maize millers in the western region is primarily linked to the availability of other food staples, such as plantains, millet, and sorghum.
Figure 4: Production Capacities of Maize Millers, by Region
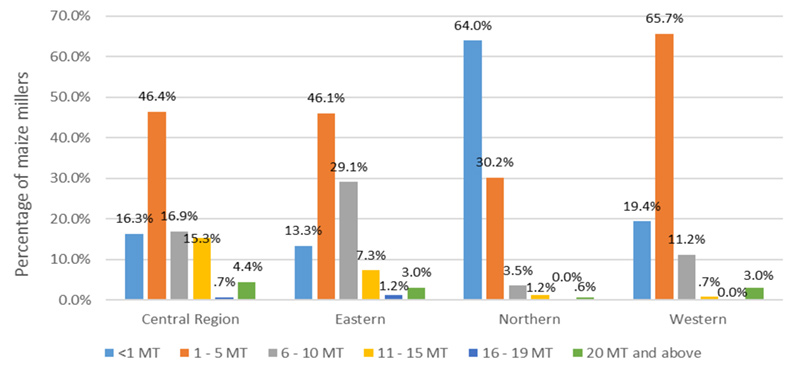
3.1.2 Regional variations in production capacities of maize millers
In the central, eastern, and western regions, most maize millers have a daily capacity of 1–5 MT(s) (see figure 4). The northern region is an exception, where the majority of maize millers have a daily production capacity of less than one MT. The overall trend in small-scale production is because the majority of millers use simple diesel machines with low-output levels.
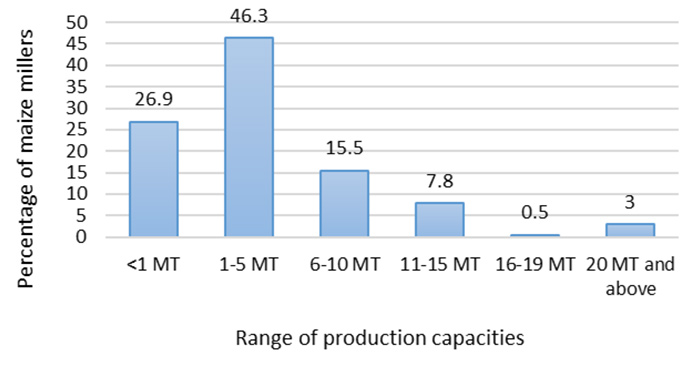
3.1.3 Percentages of average production capacity in Uganda
As shown in figure 5, most of the maize millers produce 1–5 MTs per day, (46.3 percent of all maize millers surveyed). Of the maize millers in Uganda, 26.9 percent have a production capacity of less than 1 MT per day, while 3 percent produce 20 MTs and above every day. The remainder is shared between millers producing 6–10 MTs and those producing between 11–19 MTs per day.
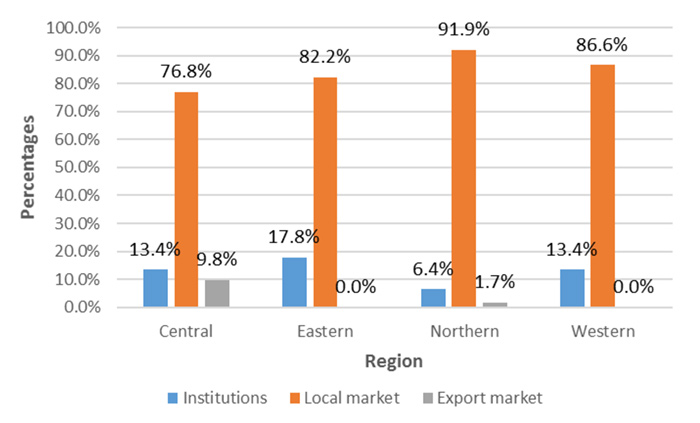
3.1.4 Target market for maize millers
Local markets, including individuals and households, are the largest purchasers of maize flour processed in all regions (83.2 percent) (see figure 6). Institutions, such as schools and hospitals, purchase 12.8 percent of the processed maize flour, and 4 percent of the maize flour is exported to neighbouring countries: Rwanda, Congo, South Sudan, and others.
Figure 5: Percentages of Average Production Capacity
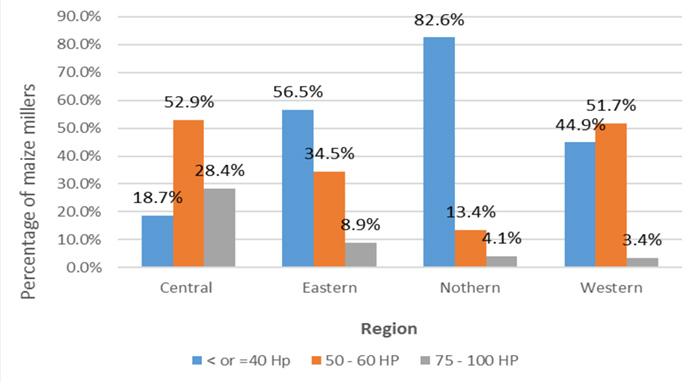
3.1.5 Size of mills owned by maize millers in Uganda
According to the survey, the motor size of the milling machine, calculated in horsepower (Hp), is one factor that determines the millers’ daily production capacity. As shown in figure 7, millers in the central and western regions own relatively larger machines, ranging between 50–60 Hp; while in the eastern and northern regions, most millers own small machines with motor sizes of 40 Hp and below. Across all the four regions, the central region has the largest number of maize millers with heavy machines and with motor sizes ranging between 75–100 Hp.
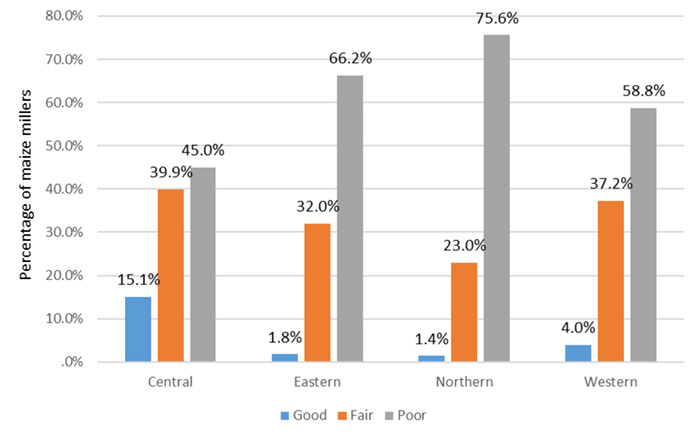
3.2 Findings on Good Manufacturing Practices
3.2.1 Trends on good manufacturing practices in the different regions
Good manufacturing practices (GMP) are recommended, with the goal of safeguarding the health of consumers, as well as producing good quality food. Complying with GMP is mandatory in all manufacturing and food processing facilities. In this survey, a checklist was used to assess the following GMP (see checklist in annex 1 and figure 8);
Figure 6: Target Market, by Region
- infrastructure status (whether constructed or not)
- sanitation status (general observed levels of cleanliness of the environment and waste disposal)
- availability of storage facilities of raw materials and finished products.
This survey found that maize millers were not adhering to GMP. This is reflected in figure 8, where 61.4 percent of the millers in all the regions exhibited poor manufacturing practices. Most of the millers in the northern region (75.6 percent) had poor manufacturing practices. Millers in the central region (39.9 percent) and western region (37.2 percent) had fair manufacturing practices. Only 1.4 percent and 1.8 percent of the millers in the northern and eastern region, respectively, had GMP.
In the central region, several mills have reasonably well-constructed permanent structures, with storage and proper sanitation facilities; in other regions, the sanitation facilities were very poorly constructed and close to the mills. It was also observed that the grains ready for milling were placed on bare floors, which could easily expose them to mold. In the northern region, poor harvesting methods were reported; burning of the maize plantation to speed up the drying process at pre-harvest period is a common practice.
Figure 7: Variations in the Motor Sizes of Machines Owned, by Region
One practice commonly observed in all the regions was the use of poor quality machinery, such as fabrication of the milling machines with local, non-food grade materials. These metal parts put the consumer at a high risk of consuming maize flour contaminated with metal chippings, especially if the facility does not use magnets to remove the metal (a GMP).
In some parts of the eastern region—for example, Buyende, Namutumba, and some parts of Bugiri—access to hydroelectric power is still a challenge; therefore, many millers resort to using diesel milling machines. The poor mechanical condition of the diesel milling machines often cause leaks in the system, which contaminates the quality of the flour. The leakage is usually a combination of diesel and lubricant oil, a hazard that puts the consumer at high risk.
In the eastern and western region, maize is sometimes of poor quality, is harvested before drying, and is mixed with newly harvested maize. Mixing newly milled batches with old batches can compromise the quality of the end product, exposing consumers to high levels of aflatoxin—which is a major health hazard.
Figure 8: Compliance with Good Manufacturing Practices of Maize Millers, by Region
In all regions, poor compliance to the packaging standard set by the Uganda National Bureau of Standards (UNBS) was common practice. It was noted that the weights listed on the bag’s packaging are not always the actual weights packed. This results from inappropriate bag dimensions: a weight of 100 kg is designed for a bag of 74×115 cm, but a common practice is packing 90 kg of flour in a smaller bag sized 72×112 cm. For a weight of 50 kgs, the goods should be packed in a bag with dimensions of 60×100 cm; but, instead, 45 kg is packed in a bag with dimensions of 60×90 cm. This shortchanges the consumer and affects the local and export market of Ugandan products.
Duplication of prominent millers’ packages by fraudsters in the milling industry was also common, and the designing of labels with non-existent brands and an untraceable physical location continues to be an issue within the milling industry.
3.3 Findings on the Status of Maize Flour Fortification in Uganda
3.3.1 Knowledge and use of fortification practices
To establish the status of maize flour fortification in the different regions, the tool captured three key indicators: the percentage of maize millers who heard about food fortification, the percentage of maize millers who had installed fortification equipment(s), and the number of millers who are currently fortifying.
Figure 9: Percentage of Maize Millers Who Have Heard About Food Fortification, by Region
As illustrated in figure 9, more than one-third of the maize millers in the central (42 percent) and eastern (34 percent) regions heard about food fortification. In the northern region, 15 percent of maize millers reported hearing about food fortification compared to 9 percent in the western region.
The relatively higher numbers of maize millers who reported hearing about food fortification could be linked to the co-existence of fortifying industries for other food vehicles, such as wheat flour and cooking oil in these regions and the social marketing strategies used by the fortifying industries to target the urban population.
As seen in figure 10, the survey identified maize millers who installed fortification equipment as a first step to the actual process of maize flour fortification. Data reveals that only 14 maize millers had installed fortification equipment nationwide, of which 10 maize millers were identified from the central region, three from the northern region, and only one from the western region.
From all the regions surveyed, only four maize millers were identified as currently fortifying maize flour(three millers in the central region, and only one in northern Uganda). No maize millers were found to be fortifying maize flour in the eastern and western regions.
3.4 Challenges Experienced by Maize Millers in Uganda
This section details the key challenges affecting the maize milling industry and collected from the four main regions. These challenges are clustered into four major categories: electricity, market, equipment, and other. See figure 11.
Figure 10: Number of Millers with Installed Fortification Equipment versus Number of Millers Currently Fortifying

3.4.1 Electricity-related challenges
This challenge is defined in two ways: high electric tariffs and poor quality or reliability of electricity; 56 percent of maize millers were challenged by issues with electricity, either cost or quality of power. As seen in figure 11, the central region is the most affected area, with 77 percent of maize millers reporting challenges with access to reliable electricity—68 percent in the western region, 53 percent in the eastern region, and 25 percent in the northern region.
The northern region reported the fewest maize millers affected by electricity. This is likely because most maize millers (more than 60 percent) in this region have a production capacity of less than 1 MT per day (see figure 7); thus, most millers own simple diesel-operated hammer mills.
3.4.2 Market challenges
Price fluctuation (due to maize poaching by other regional traders), poor quality maize, and limited access to both start-up capital and working capital were recorded as the main market challenges affecting the sector. In the northern region, 23 percent of millers had market challenges, followed by 14 percent of millers in the eastern region.
In the central and western regions, the main market challenges were stagnated demand; arrears from big buyers, especially schools; duplication and weight variations; and stiff competition in the industry.
3.4.3 Equipment challenges
Figure 11: Percentage of Maize Millers Experiencing Challenges, by Region
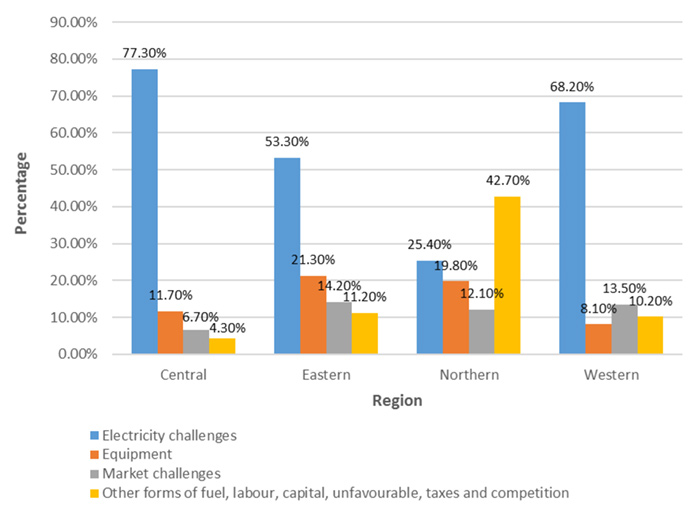
Poor quality of the equipment is a major issue. Maize milling is often done with non-food-grade hammer mills, which continuously create metal chips that are mixed in with the flour. In addition, respondents reported frequent mechanical breakdowns of the machines, affecting their production, especially in peak seasons. In both the northern and eastern regions, over 20 percent of the millers reported challenges with equipment.
3.4.4 Other challenges: fuel, labour, capital, taxes, and competition
Other challenges include high fuel prices for diesel engines, poor recordkeeping, unskilled labour, unclear taxes, and high license fees charged by local governments from the eastern region. Across all regions, millers cited limited access to working capital, falsification of weights/measurements, and duplication of brands and packaging material as major issues. This was especially prominent in the northern region, where 43 percent of millers expressed concerns with this. The challenges for millers in the northern region differ slightly from the rest of the regions, primarily because the majority of the northern maize millers reported using simple diesel hammer mills. Therefore, they reported the cost of fuel as their greatest challenge, unlike millers in the other regions.
4. Recommendations and Conclusion
4.0 General Recommendations
Support for the maize milling industry will require multi-sectoral cooperation, the engagement of public and private partners, and support from the NWGFF and other partners. The following are broad recommendations to address some of the key challenges impacting the successful uptake of fortification practices within the maize milling industry.
- Revise electricity tariffs. This was one key challenge for most millers in most regions of the country. In addition, millers require a stable supply of electricity.
- Support maize millers who have installed fortification equipment. Some millers have installed equipment but have not started fortifying, as they need assistance to calibrate their equipment and elaborate a new operational routine.
- Provide quality control and quality assurance. Training maize millers is crucial to raise awareness and address the poor manufacturing practices currently in use, such as using non-food-grade machines and mixing new and old grain in the same batch for milling.
- Improve the regulatory framework. Revising and strengthening the regulatory framework of the maize milling industry will promote quality and the safety of milled maize flour.
- Encourage miller’s associations. Functional miller’s associations in each region must be established (or better organized and managed) to enhance service delivery and support supervision by the responsible agencies.
- Increase consumer demand. Raising consumer awareness and creating demand for fortified maize flour is critical to incentivize millers to produce fortified maize flour.
- Access small-scale fortification technology. Given that most (46.3 percent) of maize millers have a daily production capacity of 1–5 MTs/day, millers need access to appropriate technologies for small-scale maize flour fortification.
4.1 Conclusion
According to the results of this survey of 780 maize millers in 62 districts, most maize millers in Uganda produce less than 20 MT per day, and the largest number of maize millers are in the central region. Across all regions, most maize millers use poor manufacturing practices, which could compromise the quality of the maize flour. In particular, using non-food grade locally fabricated equipment is one of the key challenges that may require immediate attention.
The coverage of fortified maize flour is still very low. At the time of the survey, only 0.5 percent of maize millers were actively fortifying their products. To scale up maize flour fortification, maize millers who have installed fortification equipment need support to calibrate and standardize their equipment. In addition, it is important to identify appropriate technologies that could be introduced to increase the efficiency and production for millers producing at small- and medium-scale.
References
Global Alliance for Improved Nutrition (GAIN). n.d. "Preliminary findings from national FACT survey - Uganda, September 2015." Presented at GAIN workshop, Kampala, Uganda, May 20, 2016.
Harvey, Phil, Zo Rambeloson, and Omar Dary. 2010. Determining the Dietary Patterns of Ugandan Women and Children. Washington D.C: A2Z: The USAID Micronutrient and Child Blindness Project, Academy for Educational Development (AED).