The SPRING project is a seven-year USAID-funded Cooperative Agreement to strengthen global and country efforts to scale up high-impact nutrition practices and policies and improve maternal and child nutrition outcomes. SPRING provides state-of-the-art technical support and focuses on the prevention of stunting and maternal and child anemia in the first 1,000 days. The project is managed by JSI Research & Training Institute, Inc., with partners Helen Keller International, The Manoff Group, Save the Children, and the International Food Policy Institute.
USAID in the Kyrgyz Republic has asked SPRING to improve the nutritional status of women and children within the Feed the Future zone of influence by improving nutrition-related behaviors, enhancing the quality and diversity of diets, and supporting evidence-based nutrition policies. SPRING’s geographic focus is six rayons and townships in Naryn oblast and 11 rayons and townships of Jalalabad oblast.1 SPRING’s strategies include community interventions, capacity building of health professionals and community volunteers, social and traditional media to improve nutrition practices at the household level as well as activities to strengthen the delivery of nutrition services, including counseling through the health services. At the national level, SPRING supported the development of two clinical protocols on anemia and deworming.
During 2014–2017, SPRING undertook four surveys in the target areas to gain knowledge on the current status of a range of indicators related to the nutrition practices among women and children under the age of two. The surveys were conducted by the independent research and consulting agency M-Vector in Jalalabad oblast and Jumgal rayon of Naryn oblast, as well as in Uzgen rayon of Osh oblast, which was selected as a comparison region.
Table 1: Number of Respondents Surveyed
| Surveys | Data collection dates | Intervention areas | Comparison areas |
|---|---|---|---|
| Baseline Survey | October-November 2014 | 600 | 300 |
| Winter Dietary Diversity Survey (WDD1) | April 2015 | 600 | - |
| Winter Dietary Diversity Survey (WDD2) | April 2016 | 600 | - |
| Endline Survey | February – March 2017 | 908 | 451 |
Importance of Nutrition Interventions
Stunting and anemia are serious public health problems in the Kyrgyz Republic. According to the 2012 Demographic and Health Survey (NSC, Ministry of Health [Kyrgyz Republic], and ICF International 2013), 18 percent of children under age 5 in the Kyrgyz Republic are stunted, and 6 percent are severely stunted. Additionally, 43 percent of children under 5 and 35 percent of women aged 15–49 have some degree of anemia. Since late 2014, SPRING has worked at both the community and national levels to contribute to reductions in stunting and anemia in its focus areas. The lessons learned from that program may contribute more broadly to improving nutrition among women of reproductive age and children under two years of age in the country.
Stunting and anemia are the most widespread nutritional problems affecting children and women, posing different types of threats in their lives. Anemia can be a significant cause of maternal mortality and can cause premature birth and low birthweight (Horton 2008). Anemia is caused by nutrient-poor food, inadequate food intake, poor hygiene practices, and intestinal helminths (National Statistical Committee of the Kyrgyz Republic and UNICEF 2015). Stunting is caused by chronic undernutrition and results in a child being too short for his age (Horton 2008). Stunting can have adverse effects on health and physical and cognitive development, undermining the potential of children (Victora, et al. 2008). Children with brain impairments can experience neurological problems later in life, poor performance at school, and have less earning potential than average.
The 1,000 days between pregnancy and a child’s second birthday, often referred to as the “1,000 days window of opportunity,” is a critical period for cognitive and physical development (WHO 2013). Providing proper, balanced nutrition to pregnant and lactating women and children during that period can have a positive impact on children’s growth and protect both women and children from adverse health outcomes.
SPRING promotes optimal infant and young child feeding practices, such as exclusive breastfeeding, complementary feeding, dietary diversity, and good hygiene. The project uses multiple channels to convey nutrition messages, including community outreach and support, educating health providers and community volunteers, and providing counseling for pregnant women and mothers with children under age two at health facilities and at home.
Maternal Nutrition
Iron and folic acid supplementation
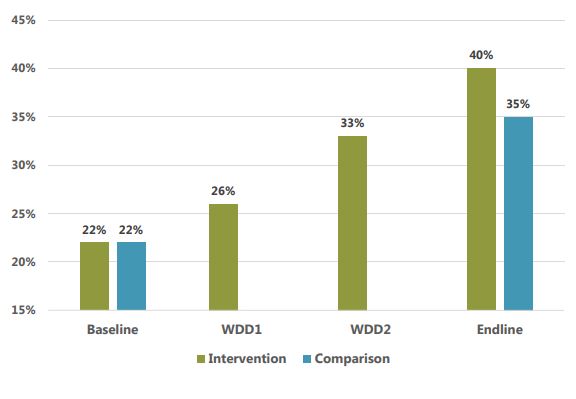
The percentage of pregnant women taking IFA for 90+ days almost doubled in areas where SPRING worked
Approximately 42 percent of pregnant women around the world are anemic and at least half of these cases are due to iron deficiency (WHO 2013). In Kyrgyzstan, 35 percent of women of reproductive age (15–49) suffer from different forms of anemia (NSC, Ministry of Health [Kyrgyz Republic], and ICF International 2013). The World Health Organization (WHO 2013) recommends that pregnant women take iron-folic acid (IFA) tablets to reduce the risk of maternal anemia and iron deficiency. IFA has been shown to reduce the risk of low birthweight and premature birth, and prevent the onset of neural tube defects in the developing fetus (NSC, Ministry of Health [Kyrgyz Republic], and ICF International 2013).
One of the main maternal health indicators is the percentage of women taking iron for at least 90 days during their most recent pregnancy. As seen in figure 1, SPRING intervention areas improved significantly in this regard. In the intervention groups, the figure increased steadily each year, beginning at 16 percent at baseline and reaching 31 percent by the endline. In the comparison area, the endline value was higher than at baseline, but the increase was less than in the intervention area.
Women’s Dietary Diversity
The nutritional status of women of reproductive age (15–49) indicates overall health of women and can be a predictor of pregnancy outcomes and of the potential for morbidity and mortality during childbirth. There is increasing evidence that maternal malnutrition contributes to the growing burden of cardiovascular (The NCD Alliance 2010) and other non-communicable diseases (SPRING n.d.). Eating diverse, nutrient-rich foods can help improve a mother’s nutritional status.
SPRING uses the number of different food groups consumed by women during the last 24 hours as an indicator for women’s dietary diversity. Dietary diversity is a useful determinant of the micronutrient adequacy of a mother’s diet. To assess dietary diversity, nine food groups were used: 1) starchy staple foods, 2) dark green leafy vegetables, 3) other vitamin A-rich fruits and vegetables, 4) other fruits and vegetables, 5) eggs, 6) dairy products, 7) meat and fish products, 8) organ meats, and 9) legumes, nuts and seeds.
The findings demonstrated that women’s diets became more diverse at endline compared to baseline. In the endline survey, women in SPRING implementation areas reported consuming increased amounts of dark green leafy vegetables (from 8 percent to 41 percent), other vitamin A-rich fruits and vegetables (from 43 percent to 74 percent), and other fruits and vegetables (from 47 percent to 88 percent). Consumption of other food groups, such as dairy products, meat and fish products, and legumes, nuts, and seeds, also increased slightly.
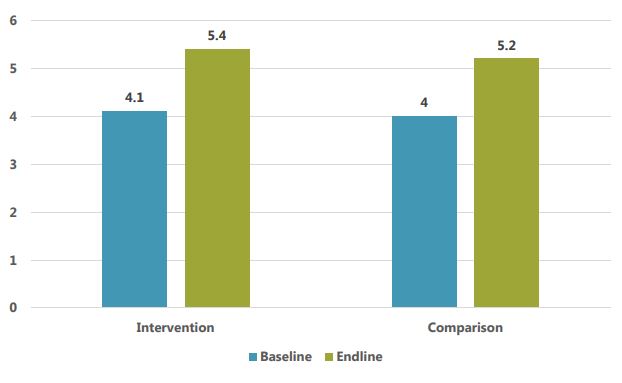
The women’s dietary diversity score in SPRING implementation areas increased from 4.1 food groups consumed on average at baseline to 5.4 at endline. Endline findings showed that 71 percent of mothers ate from five or more food groups during the previous 24 hours compared to 38 percent of mothers at baseline. While these changes in SPRING’s intervention areas are impressive, it is important to note that similar changes occurred in the comparison area, where the dietary diversity score increased from 4.0 to 5.2, and the percentage of women consuming five or more food groups increased from 37 percent at to 69 percent. The causes of the improvements in comparison area need further investigation, but could be related to greater availability of food in that oblast or nationwide, and/or to efforts by the government of Kyrgyz Republic and other partners to disseminate messages about dietary diversity across the entire country.
Figure 2: Women's Average Dietary Diversity Score
The most popular food groups consumed by women in the intervention areas at the time of the endline survey (winter) were starchy staple foods (100 percent), meat and fish products (92 percent), vitamin A-rich fruits and vegetables (74 percent), and other fruits and vegetables (88 percent). The most commonly consumed individual food items were bread/rice/noodles (98 percent), tea/coffee (96 percent), potatoes (87 percent), apples (72 percent), carrots (69 percent), and milk (64 percent).2 Encouragingly, consumption of several nutrient-rich food groups and their individual components increased significantly from baseline to endline, as shown in Table 2. On the other hand, several nutrient-rich foods were consumed by fewer than 20 percent of respondents, including organ meats (15 percent), pumpkin (13 percent), peas (10 percent), beans (6 percent), apricots (5 percent), orange-fleshed sweet potatoes (4 percent), fish (4 percent), and lentils (1 percent). The least popular food items at endline included 1) beans, peas, lentils, or nuts, 2) organ meat, and 3) fish and fish products.
Table 2: Percentage of Mothers who Consumed Food Groups during the Previous 24 Hours*
| Food Group | BL Intervention | BL Comparison | WDD1** | WDD2** | EL Intervention | EL Comparison |
|---|---|---|---|---|---|---|
| All starchy staple foods | 96% | 97% | 99% | 100% | 100% | 100% |
| Dark green leafy vegetables | 8% | 11% | 27% | 50% | 41% | 43% |
| Vitamin A-rich fruits and vegetables | 43% | 61% | 37% | 71% | 74% | 75% |
| Other fruits and vegetables | 47% | 60% | 33% | 46% | 88% | 70% |
| Eggs | 40% | 29% | 54% | 52% | 32% | 42% |
| Dairy products | 77% | 42% | 69% | 89% | 86% | 70% |
| Meat and fish products | 88% | 75% | 79% | 79% | 92% | 91% |
| Organ meat | 11% | 10% | 15% | 14% | 15% | 9% |
| Legumes, nuts and seeds | 11% | 12% | 8% | 18% | 26% | 29% |
| Numerator, N | 600 | 300 | 600 | 600 | 908 | 451 |
| Mean number of food groups | 4.1 | 4.0 | 4.1 | 5.1 | 5.4 | 5.2 |
* Numbers in bold show statistically significant difference. The results are based on a two-tailed significance test.
** WDD1 and WDD2 surveys were carried out in Intervention areas only.
In the endline survey, the most consumed vegetables rich in vitamin A included carrot, which was part of the diet about 70 percent of women in implementation areas and in the comparison area. Pumpkin and sweet potatoes were consumed by only a small number of women. The most consumed fruit was apple, consumed by 72 percent of women in the endline survey. The most widely consumed dark green leafy vegetables included cabbage and chard, consumed by 21 percent at endline, while about 5 percent of women or fewer only consumed spinach and sorrel/dock. Other commonly consumed vegetables included cabbage and cucumber. The consumption of dairy products was high in all four surveys.
An interesting finding from the surveys was that women’s dietary diversity actually increased during winter and early spring months. For example, consumption of dark green leafy vegetables in intervention areas increased from 8 percent in the fall (at baseline), to 41 percent in February/March (at endline). Significant increases were also seen in consumption of vitamin A-rich fruits and vegetables, other fruits and vegetables, and legumes, nuts, and seeds. In the first winter dietary diversity survey (WDD1), we noticed that increases in some of these foods were particularly strong in Naryn, which was surprising given that winters are longer and more severe there than in Jalalabad, limiting possibilities for local production.
Around the time of the second winter dietary diversity survey (WDD2), SPRING organized focus group discussions, during which participants were asked in-depth questions about their food consumption habits. The discussions were designed to provide us with a better understanding of the changes in consumption during different times of the year, the main barriers to consuming nutrient-rich foods, and to find out whether people ate food that they had grown for home consumption or purchased in local markets. We found that participants were very aware of the importance of diverse diets, and make an effort to obtain fresh produce; however, many reported that certain nutrient-rich foods were harder to come by during the winter. Participants also noted that a wide variety of fruits and vegetables is often available in local markets during winter months, and most households store or preserve substantial amounts of food as well.
Focus group participants mentioned a number of constraints that may prevent some people from consuming a diverse and nutrient-rich diet. In Jalalabad and Naryn oblasts, they cited economic constraints as a barrier to obtaining food in local markets, which could have affected purchases of certain kinds of products or the amount purchased. Traditions and habits were also mentioned as playing an important role in women’s diet at any time of year, especially in more traditional families where elders or men make food acquisition and consumption decisions. For example, there is a belief that eating meat and flour products makes people energetic, whereas eating fresh fruits and vegetables will leave them hungry. Participants also mentioned a belief that breastfeeding women should limit their consumption of orange fruits, which are good sources of Vitamin C, since there is a belief that consumption might cause diarrhea or an allergic reaction in their children.
Despite these potential constraints, women in the surveyed areas significantly increased the diversity of their diets over the past three years, even during winter periods.
Child Nutrition
Evidence shows that immediate and exclusive breastfeeding and the introduction of timely and appropriate complementary feeding reduces mortality and prevents chronic malnutrition (NSC, Ministry of Health [Kyrgyz Republic], and ICF International 2013). Although 99 percent of deliveries in the Kyrgyz Republic take place in a health facility and are attended by a skilled provider, only 82.5 percent of newborns are breastfed within an hour of birth (National Statistical Committee of the Kyrgyz Republic and UNICEF 2015).” Further, only 38 percent of children are exclusively breastfed at 4-5 months of age, the median duration of exclusive breastfeeding is 3.3 months, and only 56 percent of children receive breastmilk through age two (NSC, Ministry of Health [Kyrgyz Republic], and ICF International 2013).
To address these issues, SPRING trained health workers on optimal infant and young child feeding practices, with an emphasis on immediate initiation of breastfeeding after birth, exclusive breastfeeding for up to 6 months, timely and appropriate introduction of complementary food starting at 6 months, dietary diversity and feeding frequency among children 6–23 months of age, and continuation of breastfeeding to 2 years, with integration of key hygiene practices to prevent and reduce stunting and anemia. Furthermore, SPRING trained over 3,200 community volunteers on multiple topics such as IYCF, dietary diversity and maternal nutrition, hygiene and other nutritional topics to disseminate key messages through household visits and community meetings.
Early Initiation
Initiating breastfeeding within an hour of childbirth brings many benefits to newborns and mothers. Colostrum in breastmilk provides newborns vital nutrients and vitamins and contains the antibodies necessary for protection from infections and diseases. Early initiation of breastfeeding also helps prevent excessive maternal bleeding (NSC, Ministry of Health [Kyrgyz Republic], and ICF International 2013).
The following table shows breastfeeding practices at baseline and endline, in both intervention and comparison areas. Almost all mothers in all surveys reported that they had breastfed their babies, and the majority of respondents in all surveys started breastfeeding their newborn within the first hour of birth. Endline findings showed that the percentage putting the child to breast within the first hour remained essentially the same at baseline in the intervention areas, while declining substantially in the comparison are (65 percent to 58 percent). A very small proportion of children were given anything other than breastmilk during the first three days of birth. Mean duration of breastfeeding increased slightly between baseline and endline surveys in both intervention and comparison areas.
Table 3: Breastfeeding Practices (in %)
| Child nutrition practices (%, mean) | Intervention | Comparison | ||||||
|---|---|---|---|---|---|---|---|---|
| BL | EL | BL | EL | |||||
| % | N | % | N | % | N | % | N | |
| Ever breastfed | 99 | 592 | 96 | 872 | 99 | 297 | 100 | 449 |
| Breastfed within 1 hour after birth (out of mothers who ever breastfed) | 80 | 476 | 79 | 623 | 65 | 192 | 58 | 236 |
| Breastfed within 2–3 hours after birth | 12 | 72 | 16 | 128 | 28 | 83 | 36 | 146 |
| Breastfed later than 3 hours after birth | 7 | 44 | 5 | 40 | 7 | 22 | 6 | 23 |
| Mean hours a child was put first to breast after birth (out of women who ever breastfed their children later than 24 hours after delivery) | 0.94 | 540 | 0.75 | 597 | 1.35 | 388 | 1.31 | 531 |
| Received colostrum | 96 | 571 | 94 | 855 | 96 | 285 | 98 | 439 |
| Received a pre-lacteal feeding (anything other than breastmilk) within 3 days of delivery | 9 | 56 | 9 | 81 | 7 | 22 | 11 | 48 |
| Children 6–23 months who are still breastfeeding | 68 | 283 | 72 | 436 | 81 | 137 | 82 | 219 |
| Mean months of breastfeeding | 8.7 | 592 | 10.0 | 872 | 8.3 | 297 | 9.2 | 449 |
| Bottle use in previous 24 hours | 24 | 148 | 27 | 246 | 36 | 109 | 32 | 146 |
Bottle-feeding for infants is not recommended because the bottles are difficult to clean, require safe drinking water to prepare, and discourage the child from breastfeeding, among other reasons. At baseline, 24 percent of mothers in intervention regions and 36 percent in comparison regions reported that their child aged 0–23 months was given a baby bottle with a nipple the previous day or night. There were small and insignificant changes between baseline and endline surveys. The difference in usage of baby bottles across regions is mostly due to high levels of usage among older children (12–23 months) in the comparison area. Preventing further increases in this indicator will be important in the future as the Kyrgyz economy grows and modernizes and more women enter the full-time workforce.
Exclusive Breastfeeding
In SPRING implementation areas, exclusive breastfeeding more than doubled between baseline and endline surveys.
Exclusive breastfeeding during the first six months of an infant’s life benefits both mother and child. Breastfeeding protects infants from illnesses, helps ensure healthy growth and development, and reduces the risk of chronic conditions later in life (such as diabetes and obesity) (Black, et al. 2008). Breastfeeding helps mothers recover from childbirth and helps space births. SPRING findings demonstrated impressive changes in exclusive breastfeeding practices. The endline survey findings revealed a 117 percent increase in exclusive breastfeeding in implementation areas, from 29 percent of mothers in the baseline to 63 percent at endline in SPRING implementation areas, whereas in the comparison area it only increased by 14 percentage point (38 percent). Thus, not only was the increase significant between baseline and endline in SPRING-supported areas, the increase was significantly greater than the increase in the comparison area, suggesting that SPRING had a strong and positive impact on this indicator.
Table 4: Exclusive Breastfeeding Practices (in %)
| Indicators | Intervention | Comparison | ||||||
|---|---|---|---|---|---|---|---|---|
| BL | EL | BL | EL | |||||
| % | N | % | N | % | N | % | N | |
| % breastfed at time of survey (0–5 months) | 96 | 170 | 97 | 252 | 91 | 105 | 97 | 91 |
| % exclusively breastfed at time of survey (0–5 months) | 29 | 52 | 63 | 166 | 37 | 43 | 51 | 80 |
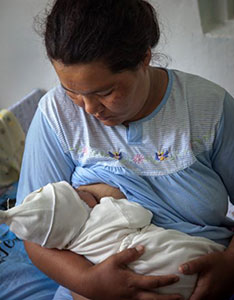
About 85 percent or more of children under 6 months of age received breastmilk six or more times in the 24 hours before the survey. The mean number of episodes of breastfeeding in the 24 hours before the survey was eight or more, with both daytime and nighttime feeding being the norm.
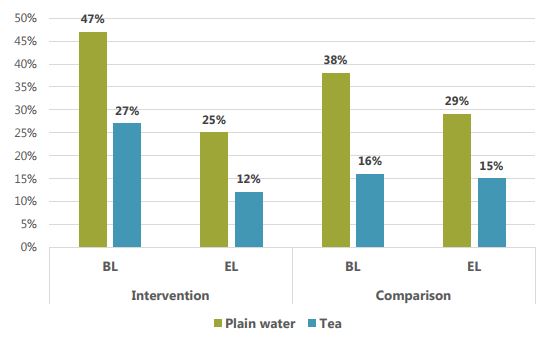
Breastmilk is the only food that has to be given to infants between the ages of 0–5 months since liquids and other foods introduced before 6 months can be detrimental to their health. The liquids most commonly given to infants were plain water and tea. As seen in figure 3 below, plain water was given to 47 percent of infants aged 0–5 months in the implementation areas at the time of the baseline, decreasing to 25 percent at the endline. Tea was given to 27 percent of infants in SPRING-supported areas at baseline, while three years later and only 12 percent were given tea to drink. Similar decreases were seen in the comparison area.
Figure 3: Percentage of Infants 0–5 Months Old Who Were Fed Liquids in the Previous 24 Hours
Complementary Feeding
When breastmilk is no longer sufficient to meet a child’s nutritional needs, mothers need to introduce other foods and liquids into child’s diet. According to WHO recommendations, mothers should begin introducing solid, semisolid and soft foods when a child reaches 6 months of age but should continue breastfeeding the child until she or he reaches two years of age (WHO 2013). Breastfeeding the child for up to two years has health benefits for the mother as well, such as improving iron levels by delaying menstruation (Black, et al. 2008).
In both the baseline and endline surveys, a large majority of mothers with children 6–8 months of age reported giving their child solid, semi-solid, or soft foods other than liquids during the previous day, Endline numbers (89 percent) were slightly higher than baseline (85 percent), suggesting that the large majority of children of that age range are receiving at least some solid/semi-solid foods. Nevertheless, the weakness in complementary feeding is that solid and semi-solid foods are often introduced too early, when an infant is to 0–5 months of age. SPRING appeared to have a strong and positive effect on both exclusive breastfeeding and the introduction of complementary foods. In SPRING intervention areas, the percentage of children 0–5 months who received solid/semi-solid foods declined by more than half (49 percent to 16 percent), in contrast to the comparison area, where the percentage declined from 32 percent to 28 percent.
Children’s Diet, Ages 6–23 Months
The main solid foods consumed by children aged 6–23 months were bread, rice, noodles and other food made of grains and meat. Other commonly consumed foods were those containing oils, fats, or butter. For the endline survey, the top three solid, semi-solid, or soft food items were bread/rice/noodles, potatoes, and meat products, with minimal differences by region. Children’s diet was only assessed during baseline and endline surveys, not during the two winter dietary diversity surveys.
Table 5 shows the consumption patterns of nutrient-rich groups of foods and other foods of interest by children aged 6–23 months. Vitamin A-rich food was consumed by 34 percent of children aged 6–23 months in implementation areas at endline, which was an impressive increase from baseline results in the same areas (23 percent). The increase compares very favorably with the comparison area, where the percentage actually decreased from 45 percent to 28 percent between baseline and endline. More specifically, within the intervention area, 27 percent of children at endline consumed vitamin A-rich vegetables compared to 18 percent of children at baseline. Similar patterns are seen with other sub-groups of vitamin A-rich foods.
Table 5. Consumption of Vitamin-Rich Food by Children Aged 6–23 Months
| Food groups | Intervention | Comparison | ||||||
|---|---|---|---|---|---|---|---|---|
| BL | EL | BL | EL | |||||
| % | N | % | N | % | N | % | N | |
| Vitamin A-rich food (Pumpkin, carrots, squash, sweet potatoes yellow or orange inside, spinach, chard, apricot, peaches, yellow melon, persimmon, tomatoes) | 23 | 97 | 34 | 219 | 45 | 83 | 28 | 84 |
| Vitamin A-rich orange vegetables (Pumpkin, carrots, squash, sweet potatoes yellow or orange inside) | 18 | 78 | 27 | 173 | 38 | 70 | 23 | 67 |
| Vitamin A-rich fruit (Apricot, peaches, yellow melon, persimmon, tomatoes) | 7 | 29 | 7 | 43 | 16 | 30 | 3 | 10 |
| Dark green leafy vegetables (Spinach, chard) | 4 | 15 | 6 | 39 | 8 | 14 | 4 | 12 |
| Any animal source food (Liver, kidney, heart, other organ meats, beef, pork, lamb, goat, chicken, duck, eggs, dried fish, shellfish, cheese) | 87 | 369 | 86 | 554 | 75 | 138 | 81 | 239 |
| Iron-rich food (Liver, kidney, heart, other organ meats, beef, pork, lamb, goat, chicken, duck, eggs, dried fish, shellfish) | 81 | 343 | 78 | 503 | 72 | 131 | 76 | 224 |
| Animal source flesh food (Liver, kidney, heart, other organ meats, beef, pork, lamb, goat, chicken, duck, dried fish, shellfish) | 69 | 293 | 71 | 457 | 59 | 108 | 65 | 193 |
| Eggs | 38 | 162 | 36 | 229 | 32 | 58 | 40 | 117 |
| Dairy (Cheese, yogurt or other milk products, milk such as tinned, powdered, or fresh animal milk) | 66 | 280 | 73 | 472 | 46 | 85 | 57 | 169 |
The majority (81 percent) of children aged 6–23 months received iron-rich food at the time of the baseline survey, a percentage which decreased slightly to 78 percent by endline. In the comparison area, consumption slightly increased. In all surveyed areas, iron is mostly obtained through beef, with other meats and organ meats consumed by small minorities of respondents. Consumption of any animal sourced food showed a similar pattern, as that group also consists mainly of beef.
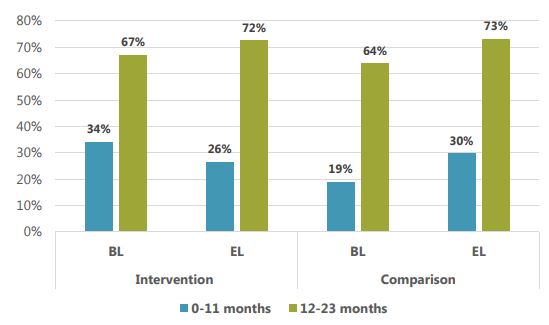
Junk food consumption (mainly sugary foods) was high among children surveyed, especially among children aged 12–23 months. Encouragingly, consumption of junk food fell substantially among children aged 0–5 months (15 percent down to 8 percent) and 6–11 months (56 percent to 46 percent) in SPRING-supported areas between baseline and endline. Conversely, in the comparison area of Uzgen, junk food consumption increased substantially, from 6 percent to 10 percent among children 0–5 months, and 37 percent to 54 percent among children aged 6–11 months.
Consumption of sugary and processed foods fell substantially in SPRING-supported areas.
In older age groups, 12–23 months, consumption of junk foods is higher in all areas (see Figure 4), and increased between baseline and endline. Junk food was reported to be the fifth most commonly consumed food among children 12–23 months of age in both intervention and comparison areas. Increases in the comparison area were slightly higher than in the intervention areas. Overall, these results suggest that SPRING had notable success in reducing junk food consumption or slowing the natural increase in consumption among the youngest children where such consumption can be especially damaging.
Figure 4: Consumption of Sugary Foods by Children Aged 0–11 Months and 12–23 Months (in %)
Feeding Frequency and Dietary Diversity
Mothers were also asked how many times children between the ages of 0 to 23 months consumed solid, semisolid, or soft food during the day or night. Frequency of food consumption for children aged 6–11 months in implementation areas increased from 1.7 to 2 times per day. For older children (aged 12–23 months), feeding frequency also increased in the implementation areas, from 2 times to 2.7 times per day.
Children’s dietary diversity increased significantly from 42 to 54 percent in areas where SPRING worked.
According to the WHO, the minimum required frequency of feeding for non-breastfed children aged 6–23 months is four times a day (WHO 2010). SPRING endline findings showed that a majority of non-breastfed children in implementation areas met the minimum requirements (70 percent in Jumgal, 65 percent in Jalalabad), while only 41 percent met the requirement in Uzgen. However, the minimum meal frequency dropped compared to the 2014 baseline. There could be many factors affecting this finding. SPRING will undertake qualitative research in 2018 to better understand the causes of this reduction and other indicators where results did not align with our hypotheses.
Consumption of foods from at least four food groups on the previous day would mean that in most populations the child had a high likelihood of consuming at least one animal-source food and at least one fruit or vegetable that day, in addition to a staple food (grain, root, or tuber). Substantial improvements in children’s dietary diversity occurred over the course of the surveys, especially in implementation areas. Endline findings showed that 54 percent of children ate from four or more food groups during the last 24 hours, a significant increase from 42 percent at baseline, while in the comparison area, the figure fell slightly from 46 percent at baseline to 41 percent at endline (not significant).
Table 6: Percentage of Children Aged 6–23 Month Who Consumed Four or More Food Groups
| Indicator | Intervention | Comparison | ||||||
|---|---|---|---|---|---|---|---|---|
| BL | EL | BL | EL | |||||
| % | N | % | N | % | N | % | N | |
| % of children 6-23 months, who ate foods from four or more food groups in the previous 24 hours | 42% | 422 | 54% | 645 | 46% | 183 | 41% | 295 |
Handwashing
Having clean hands and practicing other good hygiene measures is also important for preventing infections and undernutrition in infants. SPRING promoted the practice of “handwashing at five critical times” through community activists, who carried out household visits and community events. The five critical times to wash hands are: 1) before preparing food, 2) before feeding the child, 3) after using the latrine, 4) after cleaning the child, and 5) after handling animals/livestock.
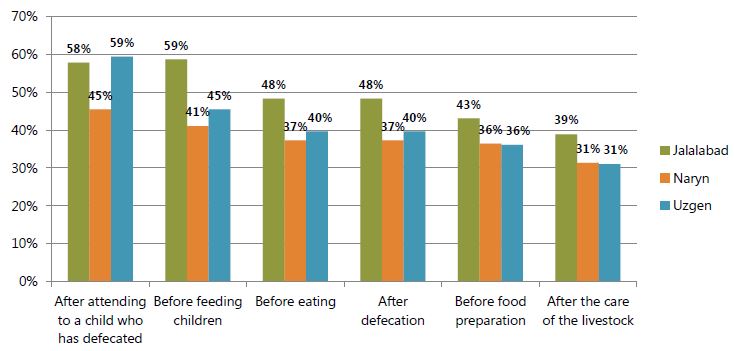
As seen in figures 5 and 6, women were significantly less likely to report handwashing in the endline survey than in the baseline. Women were asked, “When do you usually wash your hands?” with prompting for multiple responses, in both surveys. Promotion of handwashing “after handling livestock” was added to the program after the baseline.
In the endline survey (figure 6), levels of reported handwashing were lower than at baseline for almost all critical moments and regions. For example, at baseline, 98 percent of Jalalabad residents, 95 percent in Uzgen, and 79 percent in Naryn reported washing hands after defecation. By the endline, these figures had fallen to 48 percent, 40 percent, and 37 percent, respectively. Steep declines were also reported for the other critical moments, the one exception being “after attending a child who defecated,” which was mentioned significantly more often at endline than at baseline.
Figure 5. Percentage Reporting That They Usually Wash Their Hands, by Critical Moment (Baseline)
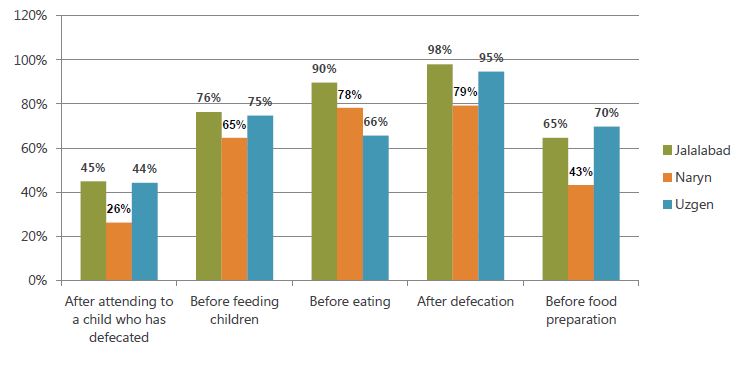
Figure 6. Percentage Reporting That They Usually Wash Their Hands, by Critical Moment (Endline)
SPRING was surprised by declines in reported handwashing and carried out qualitative research to explore potential reasons. The research investigated whether seasonal change affected handwashing and, in particular, whether the cold winter climate would cause people to be less likely to wash their hands, especially in rural areas where households might have outdoor toilets and outdoor water sources. The baseline took place in October and November before winter weather begins, and the endline took place in February and early March, when temperatures are especially low.
The qualitative research did reveal many reasons why women may wash their hands less often in the winter. figure 7 summarizes some of the main explanations given by FGD participants and key informants.
Figure 7: Factors Affecting Optimal Hand Washing Practices During the Winter
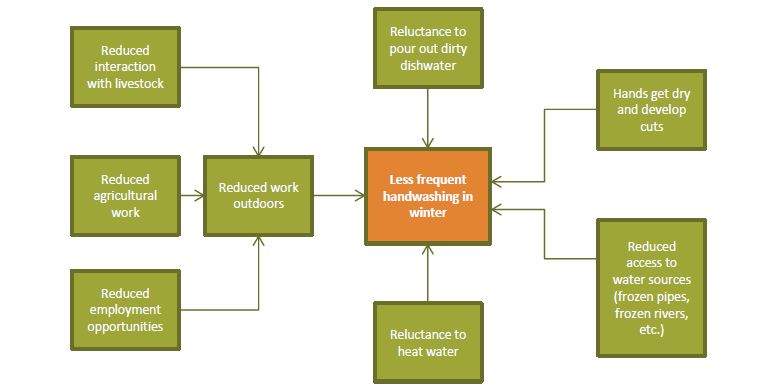
As detailed in the figure, we see that there are many likely reasons why handwashing declines in winter. Some are directly related to cold weather (frozen pipes, frozen rivers), while others are indirectly related (less outdoor employment opportunities).
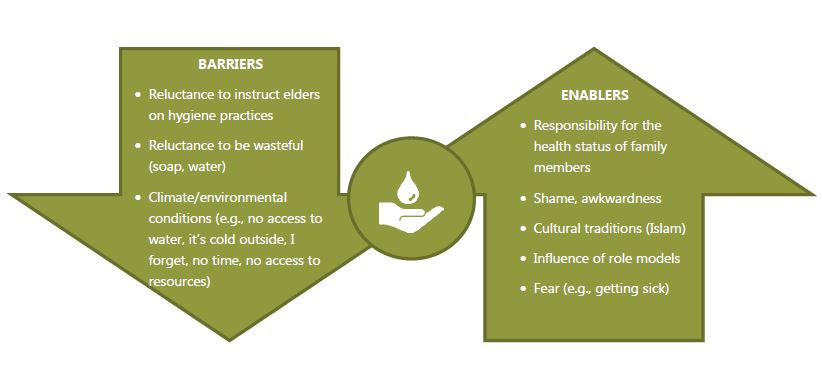
The qualitative research also identified several factors that were not necessarily seasonal. figure 8 shows some of the additional enablers and barriers to handwashing reported by participants, such as the knowledge that handwashing is beneficial to health (enabler), Islamic religious beliefs (enabler), environmental conditions (barrier), and reluctance to instruct older household members (barrier). In general, results of the qualitative research suggested that a decrease in handwashing during the winter is to be expected. Additionally, it is encouraging that declines in handwashing practices in the SPRING areas were less than the declines in the comparison area, even when considering winter factors. The results suggest that SPRING interventions may have ameliorated the barriers and other factors believed to result in declined practices.
Figure 8: Enablers and Barriers to Optimal Handwashing Practices
Sources of Key Nutrition and Hygiene Messages
SPRING attempted to improve nutrition practices through a number of channels and multiple reinforcing messages. One strategy was to reach community members through community outreach. To accomplish this, SPRING mobilized approximately 2,600 community volunteers and trained them to deliver nutrition and hygiene messages to households in Jalalabad and Naryn oblasts, particularly those with pregnant and lactating women and children under the age of two. Each quarter, community volunteers reach over 120,500 mothers and caregivers, and over 20,000 children under the age of two from about 30,000 households via household visits and community meetings in 217 targeted villages. In addition, 5,759 SPRING-trained health providers at 302 health facilities are supporting and promoting breastfeeding and complementary feeding practices by counseling mothers and other family members who visit the facilities. Since 2015, those trained health workers have had more than 275,800 contacts with mothers of children under the age of two, providing them with nutrition services and counseling. Additionally, more than 130,000 pregnant women received anemia counseling at SPRING-supported health facilities.
Table 7 presents key messages heard by mothers and the main sources of the information, providing an estimate of the reach of SPRING’s messages. Mothers were asked to report all the sources from which they had received information on the topic in question. The three sources mentioned most often were health facilities, community meetings, and household visits, though the main source varied substantially by topic. For instance, the source of information on exclusive breastfeeding was overwhelmingly a visit to a health facility (89 percent), while for complementary feeding, the majority (50 percent) cited health facilities, but substantial numbers also cited household visits and community meetings. For messages on food storage, deworming, and other nutrition topics, community meetings were cited as the main source of information. While it is impossible to know for sure that the messages received were directly attributable to SPRING, it is noteworthy that the three main sources of messages were the three main channels through which SPRING worked.
Table 7: Percentage of Mothers Who Reported Hearing or Receiving Any Information on Following SPRING Key Nutritional Messages, by Sources of Information (Endline Survey Only, in %)
| Key messages disseminated by SPRING in implementation areas | HH visits | Community meetings | Health facility | Friends/ neighbors | Newspapers | Internet | TV | |||||||
|---|---|---|---|---|---|---|---|---|---|---|---|---|---|---|
| % | N | % | N | % | N | % | N | % | N | % | N | % | N | |
| Exclusive Breastfeeding | 7 | 41 | 0 | 3 | 88 | 552 | 3 | 17 | 1 | 6 | 1 | 8 | 0 | 2 |
| Complementary Feeding | 37 | 254 | 26 | 178 | 57 | 395 | 1 | 10 | 1 | 5 | 1 | 7 | 0 | 1 |
| Dietary Diversity | 35 | 240 | 31 | 209 | 50 | 336 | 2 | 13 | 1 | 6 | 1 | 6 | 1 | 8 |
| Anemia | 28 | 188 | 33 | 222 | 55 | 367 | 1 | 7 | 0 | 1 | 1 | 4 | 1 | 8 |
| Hygiene | 36 | 242 | 30 | 203 | 50 | 337 | 1 | 9 | 1 | 9 | 1 | 10 | 1 | 8 |
| Maternal Nutrition | 36 | 254 | 25 | 176 | 58 | 402 | 2 | 11 | 0 | 2 | 1 | 7 | 1 | 8 |
| Food Storage and Preservation | 17 | 81 | 67 | 316 | 14 | 65 | 6 | 27 | 1 | 7 | 2 | 9 | 3 | 16 |
| Intestinal Worms | 22 | 116 | 56 | 297 | 31 | 166 | 1 | 6 | 1 | 5 | 0 | 2 | 2 | 12 |
| Other Nutritional Messages | 25 | 139 | 50 | 279 | 29 | 163 | 2 | 9 | 1 | 6 | 2 | 13 | 3 | 15 |
Footnotes
1 SPRING expanded beyond the Feed the Future zone of influence in 2017 and began rolling out clinical training program in 21 health facilities in Bishkek city.
2 These data are based on respondents’ answers to questions about what they ate in the previous 24 hours.
References
Black, Robert E., et al. "Maternal and Child Undernutrition: Global and Regional Exposures and Health Consequences." The Lancet 371, no. 9608 (2008): 243-260.
Horton, Richard. "Maternal and Child Undernutrition: An Urgent Opportunity." (The Lancet) 371, no. 9608 (2008): 179.
National Statistical Committee of the Kyrgyz Republic and UNICEF. Kyrgyzistan Multiple Indicator Cluster Survey 2014, Final Report. Bishek, Kyrgyzsta: National Statistical Committee of the Kyrgyz Republic and UNICEF, 2015.
NSC, Ministry of Health [Kyrgyz Republic], and ICF International. Kyrgyz Republic Demographic and Health Survey 2012. Bishek, Kyrgyz Republic and Calverton, MD: NSC, MOH, and ICF International, 2013, 187.
SPRING. Preventing Nutrition-Related Noncommunicable Disease. https://www.spring-nutrition.org/technicalareas/systems/n-rncds .
The NCD Alliance. "Non-Communicable Diseases: A priority for Women’s Health and Development." 2010.
Victora, Cesar G., et al. "Maternal and Child Undernutrition: Consequences for Adult Health and Human Capital." The Lancet 371, no. 9609 (2008): 340–357.
WHO. Essential Nutrition Actions: Improving Maternal, Newborn, Infant and Young Child Health and Nutrition. Geneva, Switzerland: World Health Organization (WHO), 2013.
