Effects on Women and Children's Nutrition and Hygiene Behaviors
1. Description of the Intervention and Key Outcomes
1.1. Description of the Intervention
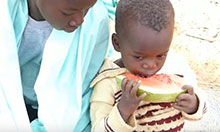
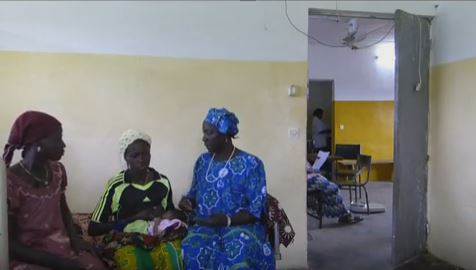
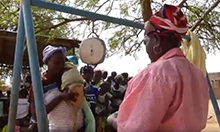
The SPRING project introduced a community media approach in Burkina Faso in February 2016 to reduce undernutrition. The goal of the SPRING pilot intervention in Burkina Faso was to contribute to improvements in child feeding practices, including minimum dietary diversity, minimum meal frequency, and minimum acceptable diet. In the project, videos were produced locally using actors based in the community, on topics developed in consultation with community members. Trained disseminators held village-level screenings with women’s group members and then facilitated discussion on the topics covered in the videos. Group members who viewed the videos also received a home visit within one week after the viewing to discuss the behavior and verify whether the behavior was adopted, changed, or promoted.
The titles of the four videos disseminated between August 2016 and March 2017 were:
- Diet Diversification (August 2016)
- Exclusive Breastfeeding (September/October 2016)
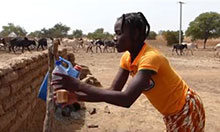
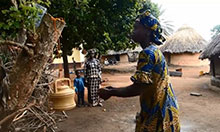
- Handwashing Practices (January 2017)
- Complementary Feeding (March 2017)
SPRING partnered with REGIS-ER in the Manni commune, in the East region. REGIS-ER had established two women’s groups (a breastfeeding and a pregnancy women’s group) in a number of villages throughout the commune. Each group typically included about 15 women, who remain in the group for approximately one year. SPRING selected 10 of these villages to initiate community video activities. An additional 10 villages in the Manni commune had also established women’s groups but were not sites with community video activities.
In the Gayeri commune, also in the East region, SPRING partnered with the FASO project. The FASO project had also established two women’s groups (a breastfeeding group and a group for pregnant women) in a number of villages throughout the commune. SPRING selected 15 of these villages to initiate community video activities. An additional 15 villages in the Gayeri commune also had established women’s groups but did not have community video activities.
1.2. Description of Key Outcomes
Table 1 shows the video themes and associated evaluation indicators. As mentioned above, the intervention consisted of projecting videos with different themes on the nutrition of women and children, as well as hygiene, with monthly dissemination during group meetings. From August 2016 to March 2017, four videos were shown, focusing on dietary diversity and resilience (video 1), the importance of exclusive breastfeeding (video 2), age-appropriate complementary feeding for babies age 6–23 months (video 3), and the importance of handwashing with soap (video 4). To assess the change in each theme after completion of the intervention, 12 indicators were proposed: two indicators for video 1, one indicator for video 2, four indicators for video 3, and five indicators for video 4. Most of the indicators were defined and calculated on the basis of the latest World Health Organization (WHO) recommendations on indicators for assessing infant and young child feeding practices (WHO et al. 2008; 2010).
Table 1.1. UNAP Objectives and Strategic Areas
| Video Theme | Indicator (Outcomes) |
|---|---|
| Video 1: Dietary Diversity and Resilience |
|
| Video 2: Importance of Exclusive Breastfeeding |
|
| Video 3: Age-Appropriate Complementary Feeding for Babies 6–23 Months |
|
| Video 4: Importance of Handwashing with Soap |
|
2. Methodology
2.1. Study Population and Sampling
This study used a quasi-experimental approach to test the ability of video projections to change nutrition and hygiene behaviors in two rural communes of the East region (Manni and Gayéri). The study design was quasi-experimentational in nature because it used existing lists of women to constitute the intervention zone and the control zone. These lists of women were previously constituted by two programs (REGIS-ER and the FASO project) in the framework of their ongoing activities. In both study areas, a survey was conducted before and after implentation of the intervention.
Estimation of Sample Size
To estimate the sample size, we used the 2010 Burkina Faso DHS to calculate the following indicators for the East region of Burkina Faso: (1) the proportion of children aged 0–5 months who were exclusively breastfed 24 hours before the survey, (2) the proportion of children aged 6–9 months who received complementary food 24 hours before the survey, and (3) the prevalence of anemia among pregnant women. The inclusion of the last indicator (3) is justified because information on the dietary diversity score (24 hours prior to the survey) in pregnant women is not available in the 2010 DHS. However, the information for anemia in women is available. Assuming a relatively strong relationship between the two indicators, we estimated the prevalence of anemia among pregnant women as a proxy.To estimate the sample size, we used the 2010 Burkina Faso DHS to calculate the following indicators for the East region of Burkina Faso: (1) the proportion of children aged 0–5 months who were exclusively breastfed 24 hours before the survey, (2) the proportion of children aged 6–9 months who received complementary food 24 hours before the survey, and (3) the prevalence of anemia among pregnant women. The inclusion of the last indicator (3) is justified because information on the dietary diversity score (24 hours prior to the survey) in pregnant women is not available in the 2010 DHS. However, the information for anemia in women is available. Assuming a relatively strong relationship between the two indicators, we estimated the prevalence of anemia among pregnant women as a proxy.
The estimation formula of the sample size is:
n = z² * p * (1-p) * g * (1 + t) / m²
- n: minimum sample size for obtaining significant results for an event and a level of risk
- z: confidence level (typical value associated with a given confidence level)
- p: probability of the event occurence
- g: cluster effect
- t: rate of non-response
- m: margin of error
From the above three indicators, with an accuracy rate of 10 percent, the estimated sample size is 383 women of reproductive age (WRA) per survey area; giving 383 x 2, totaling 766 WRA for the two survey areas. To account for possible attrition between the two rounds of the survey, the sample size was finally adjusted to 525 per survey area, totaling 1,050 WRA.
Selection of Villages
The villages were selected by reasoned choice (by the Faso and REGIS-ER projects) among the intervention villages of these two projects already existing in the two communes of the East region (Manni and Gayéri). REGIS-ER was covering several villages in the commune of Manni and the Faso project was covering several villages in the commune of Gayéri. Based on the minimum number of children under two years of age required to estimate nutrition indicators, 50 villages were selected. The distribution of the 50 selected villages between the intervention area and the control area was also done by reasoned choice (by the FASO project and REGIS-ER). This distribution was made with the support of REGIS-ER and FASO project field officers, so that the villages of the two groups are as similar as possible. A total of 25 intervention villages was initially planned (10 in Manni and 15 in Gayéri), with 25 control villages (10 in Manni and 15 in Gayéri). However, during the implementation of the intervention, two villages that were to be covered were not surveyed, due to difficulty in accessing the villages. The intervention team replaced these two villages with two new villages; however, these new villages had not been surveyed during the first phase of the survey. Finally, there were 23 intervention villages (9 in Manni and 14 in Gayéri), and 27 control villages (11 in Manni and 16 in Gayéri).
Selection of Women of Childbearing Age
Participants were selected from the lists of women who were already constituted and then updated at the beginning of the baseline survey in May 2016 by REGIS-ER and the FASO project. As part of their activities, each of these programs organized women into two self-help groups in each village (15 women per group)—breastfeeding women and pregnant women. For the purposes of this study, all 15 breastfeeding women per village were selected for the household survey. However, of the 15 pregnant women, only six were randomly selected. This choice is justified by the desire to have an optimal number of children aged 0–23 months in order to allow estimating the indicators at the level of the child. It should be emphasized that, in estimating the indicators, weighting coefficients were applied to take into account the sampling design. A total of 1,050 women of reproductive age were selected according to the sampling.
2.2. Data Collection
Data were collected in two rounds. For the follow-up survey, the interviewers collected data from the same women who participated in the baseline survey. Data were collected by 20 interviewers using an electronic questionnaire via tablets. The interviewers were organized into five teams of four (including a team leader) under the supervision of the Institut Supérieur des Sciences de la Population (ISSP) research team. Each team of interviewers was responsible for covering 10 villages. The first phase of the survey took place in May–June 2016 and the second phase in March–April 2017. During both phases, women were interviewed face-to-face in their homes, by the same interviewers.1
2.3. Data Analysis
The difference-in-difference method was used to estimate the effect of video projections on nutrition and hygiene behaviors. This method consists in measuring changes in hygiene and nutrition outcomes between the beginning and the end of the project, and between the population concerned with video projections and the control population. It is assumed that the trend observed in the control population (the difference between baseline and the end of the intervention) is the same that would have occurred in the area of intervention in the absence of intervention. This method is valid only if the differences observed between the control group and the treated group comes only from the impact of video projections and not from differences in observable or unobservable characteristics of villages, households, women, or children.
The main difficulty, therefore, was to identify a control zone with observable characteristics most similar to those in the area of intervention, assuming that differences in unobservable characteristics are insignificant. In addition, it was necessary that the control zone not be too close geographically to the area of intervention, in order to avoid the potential spread of the effects of the intervention to neighboring areas. This condition was relatively little respected insofar as there were intervention and control villages selected in the same commune. Given this geographical proximity, the participation of women at various local markets and social events (marriage, baptism, etc.) could, for example, be a venue for information sharing. Finally, it was desired that the control area not benefit from any specific program over the duration of the intervention, so that the impact of the intervention would not underestimated as a result of improved nutrition and hygiene conditions in the control area linked to this specific program. This latter condition was difficult to verify, since REGIS-ER and the Faso project, which had already been present in various localities in the East region for several years, could have had activities directly or indirectly linked to the hygiene and nutrition conditions of women and children in the areas included in the study. Other similar sectoral programs may have been implemented in the study areas as well.
On the basis of the data collected during the baseline survey (before the start of the intervention), it was possible to check whether the choice of villages and their distribution between the two areas (intervention and control) resulted in a control area with observable characteristics similar to the area of intervention. This similarity, if any, suggested that the temporal dynamics of the two zones in terms of hygiene and nutrition would be identical in the absence of intervention. However, according to the description of the sample (see the next section), it was observed that a large number of characteristics differed between the two zones. To overcome the difficulty somewhat, we controlled for the main characteristics of women in estimating nutrition and hygiene outcomes.
3. Results
3.1. Description of the Sample
Table 2 shows the situation of the sample of women surveyed during the two phases of the survey. At the baseline survey, 1,050 women (567 for the control area and 483 for the treatment area) were successfully interviewed according to the sampling design.2 At the endline survey, 968 women (512 for the control zone and 456 for the treatment area) were interviewed; this corresponds to an attrition rate of 7.8 percent between the two phases of the survey. This attrition rate, which is higher in the control area (9.7 percent) than in the treatment area (5.6 percent), can be explained mainly by these reasons: (1) the absence of women at the time of the second phase of the survey, which accounted for 46 women (26 for the control zone and 20 for the treatment area); (2) the unavailability of two women3 from the control zone at the time of the second phase of the survey; and (3) the removal of a total of 34 women (27 from the control zone) who did not know the month of birth of their last child at the time of the baseline survey. The main reason for this is that, without exact knowledge of the child’s month of birth, it is impossible to determine the target group for each phase of child nutrition (e.g., 0– 5 months for exclusive breastfeeding, 6–8 months for complementary feeding).
Table 2: Comparison of the Sample of Women Surveyed at Baseline and Endline between Control and Treatment Areas
| Situation of Women Surveyed | Baseline | Endline | ||||||||||
|---|---|---|---|---|---|---|---|---|---|---|---|---|
| Control | Treated | Total | Control | Treated | Total | |||||||
| n | % | n | % | n | % | n | % | n | % | n | % | |
| Present | 540 | 95.2 | 476 | 98.6 | 1,016 | 96.8 | 512 | 94.8 | 456 | 95.8 | 968 | 95.3 |
| Removed* | 27 | 4.8 | 7 | 1.5 | 34 | 3.2 | 0 | 0.0 | 0 | 0.0 | 0 | 0.0 |
| Absent | 0 | 0.0 | 0 | 0.0 | 0 | 0.0 | 26 | 4.8 | 20 | 4.2 | 46 | 4.5 |
| Not Available | 0 | 0.0 | 0 | 0.0 | 0 | 0.0 | 2 | 0.4 | 0 | 0.0 | 2 | 0.2 |
| Total | 567 | 100.0 | 483 | 100.0 | 1,050 | 100.0 | 540 | 100.0 | 476 | 100.0 | 1,016 | 100.0 |
Note: * The 34 women were removed by the JSI team after the baseline survey because they did not know the month of birth of their last child under two years of age. Source: 2016–2017 JSI-ISSP SPRING Survey, Burkina Faso.
3.2. Comparison of Treatment and Control Areas at the Baseline Survey
Sociodemographic Characteristics of Women
Table 3 compares key characteristics from the two groups of women in the baseline survey. There was no statistical significant difference in terms of age (although women in the control group appear to be relatively younger), previous residence, co-residence with the husband, pregnancy status, or possession of a radio. In addition, across both arms, the Christian religion was the most represented, followed by the Muslim religion and traditional beliefs. However, women in the control zone were more educated, more monogamous, had fewer children, listened more frequently to the radio, and watched television more frequently than those residing in the intervention zone. These observed differences between the treatment and control areas were taken into account in estimating the effects of the intervention by controlling for the variables.
Table 3: Comparison of the Characteristics of Women Surveyed at the Baseline between Control and Treatment Areas
| Characteristics of Women Surveyed | Mean or Percentage | Significance of (2)-(1) | |
|---|---|---|---|
| Control Group (1) | Treated Group (2) | ||
| Age (years) | 26.5 | 27.1 | ns |
| Parity | 3.4 | 3.8 | ** |
Pregnancy Status
|
|
|
|
Previous Residence
|
|
|
|
Level of Education
|
|
|
|
Literacy
|
|
|
|
Religion
|
|
|
|
Type of Union
|
|
|
|
Co-residence with Husband
|
|
|
|
Possession of Radio
|
|
|
|
Listen to the Radio
|
|
|
|
Watch Television
|
|
|
|
| Observations | 539 | 475 | 1,014 |
Note: *** p < 0.01; ** p < 0.05; * p < 0.1 ; ns p > 0.10 (not significant)
Source: 2016–2017 JSI-ISSP SPRING Survey, Burkina Faso.
Characteristics of the Last Child under Two Years of Age at the Time of Survey
In terms of the last child of the woman interviewed the three main characteristics likely to influence nutrition behaviors (age, gender, and twins). Table 4 shows that there was no difference between the control area and the intervention area.
Table 4: Comparison of Characteristics of the Last Child under Two Years of Age in Baseline Survey between Control and Treatment Areas
| Child Characteristics | Mean or Percentage | Significance of (2)-(1) | |
|---|---|---|---|
| Control Group (1) | Treated Group (2) | ||
| Age (months) | 9.7 | 9.5 | ns |
Sex
|
|
|
|
Twins
|
|
|
|
| Observations | 384 | 344 | 728 |
Note: ns p > 0.1 (not significant).
Source: 2016–2017 JSI-ISSP SPRING Survey, Burkina Faso.
Characteristics of Women’s Social Networks
The previous interactions the women had about breastfeeding, nutrition, and hygiene had the potential to guide their future behaviors on nutrition and hygiene. Therefore, it is necessary to compare the characteristics of women’s social networks in the two zones before the implementation of the intervention. The characteristics of the social network considered included size of the network (i.e., the number of people with whom the woman interacted on breastfeeding or feeding during the last two weeks before the survey), the characteristics of the woman’s main source of information on breastfeeding or feeding (gender, place of residence, education, relationship), and the frequency and direction of interactions.
As shown in Table 5, the number of social contacts of women on breastfeeding or feeding before the implementation of the intervention was similar and relatively across the two zones. The women in the treatment area and those in the control area had interactions with an average of two people about breastfeeding or feeding in the last two weeks prior to the baseline survey. This suggests that, in both areas, women’s level of knowledge of good breastfeeding and feeding practices was not negligible prior to the intervention. Regarding the characteristics of the main person with whom the woman interacted, there was no difference found between the treatment area and the control area in terms of level of education and direction of interactions. However, the proportion of female social contacts was found to be higher in the control area (95.5 percent) than in the treatment area (90.5 percent). In addition, the proportion of social contacts outside the village (in the same commune or elsewhere) was found to be higher in the control area than in the treatment area—this represented an opportunity for dissemination of the intervention in cases where intervention villages and control villages were in the same commune. The interactions with social contacts also appeared to be more frequent in the control area than in the treatment area. For example, 8.5 percent of women in the control area reported interacting daily with their main social contact, compared with only 4.1 percent for the treatment area. Therefore, the social network was likely to exacerbate the problem of dissemination of the intervention effects between treatment and control areas.
Table 5: Comparison of the Characteristics of Women’s Social Network at the Baseline between the Control and Treatment Areas
| Characteristics of Women’s Social Networks | Mean or Percentage | Significance of (2)-(1) | |
|---|---|---|---|
| Control Group (1) | Treated Group (2) | ||
| Characteristics of the first social contact on breastfeeding or feeding children | |||
| Number of social contacts on breastfeeding or feeding in the last two weeks prior to the survey | 1.8 | 1.9 | ns |
Gender
|
|
|
|
Residence of social contact
|
|
|
|
Education
|
|
|
|
Relationship with social contact
|
|
|
|
Frequency of interaction with social contact
|
|
|
|
Direction of interactions with social contact
|
|
|
|
Note: *** p < 0.01; ** p < 0.05; * p < 0.1
Source: 2016–2017 JSI-ISSP SPRING Survey, Burkina Faso
3.3. Women’s Exposure to the Intervention
Before estimating the impact of the intervention, it is appropriate to evaluate the level of exposure of women to the intervention after the implementation of the project. As a reminder, the intervention consisted mainly of holding video screenings in the area of intervention that conveyed messages on feeding and hygiene. The evolution of women who received feeding or hygiene messages via video projections after implementation of the intervention provides an idea of the level of women’s exposure. Moreover, the exposure of women to other competing channels carrying similar messages could not be excluded, in either the intervention zone or the control zone. This exposure had the potential to considerably limit the scope of impact of the intervention (the video projections).
Women’s Exposure to Feeding Messages
Before the intervention began, the vast majority of women surveyed had already been exposed to food messages (Table 6). The general level of women’s prior exposure to these messages was 76.5 percent in the control area and 79 percent in the intervention area, which is an important background in terms of nutrition knowledge. In terms of sources of information, exposure to food messages via video screenings prior to the intervention was very low (1.5 percent in the intervention area and 0.8 percent in the control area), as expected. Meetings in the community, which were significantly more frequent in the area of intervention (77.1 percent) than in the control area (67.9 percent), were the most common source of feeding messages, followed by radio, which was slightly less prevalent in the intervention area (34.3) percent than in the control area (39.3 percent), visit to a health center (30.5 percent in the treatment area, compared to 28.9 percent in the control area), and visit from a community member at home (11.4 percent in the treatment area, compared to 8 percent in the control area). The existence of these competing channels of information was likely to dilute the impact of video screenings on women’s and children’s feeding behaviors.
After completion of the intervention, women’s overall level of exposure to feeding messages increased to 95.3 percent in the intervention area and 93 percent in the control area.4 However, the channels of information that contributed to this increase differ from one area to another. The weight of video projections reached 30.2 percent in the area of intervention (compared to an initial level of 1.5 percent), whereas it remained very low in the control zone (1.4 percent, compared to an initial level of 0.8 percent). Clearly then, the implementation of video screenings to convey feeding-related messages functioned relatively well, resulting in a net effect of 28.1 percent in favor of the intervention area between the two survey phases (Table 6). However, it should be pointed out that, despite this increase, the video screenings were not the primary source of feeding information in the area of intervention, but ranked third, after community meetings and radio.
The number of community meetings increased in both areas and remained higher in the area of intervention (86.5 percent) than in the control area (76.4 percent). However, the weight of a visit to a health center (whose difference between the two areas was not statistically significant prior to the start of the intervention) increased significantly in the control area (31.6 percent), compared to the area of intervention (25.9 percent). The same applies to radio, whose weight reached 48.8 percent in the control zone, compared to 40 percent in the intervention zone. The most striking variation was with visit of a community member as an information source, whose weight remained almost stable in the area of intervention (10.8 percent, compared to an initial level of 11.4 percent), whereas its weight increased from only 8 percent to 24.5 percent in the control area—a net increase of 17.1 percent for the control area between the two phases of the survey. This situation may be explained by the fact that the knowledge shared in the video projections related to feeding messages was also diffused in part by other channels, notably radio and community member visits.
Table 6: Exposure of Women Surveyed to Feeding Messages
| Exposure | Percentage | ||||||
|---|---|---|---|---|---|---|---|
| Baseline | Endline | Effect (Difference-in-Difference) | |||||
| Control | Treated | Diff (T-C) | Control | Treated | Diff (T-C) | ||
| Source of exposure to feeding messages | |||||||
| Exposure to feeding messages | 76.5 | 79.0 | 2.5 | 93.0 | 95.3 | 2.4 | -0.2 |
| Displays in the community | 0.4 | 0.2 | -0.2 | 0.4 | 0.4 | 0.0 | 0.2 |
| Community meetings | 67.9 | 77.1 | 9.3*** | 76.4 | 86.5 | 10.1*** | 0.8 |
| Public services of government | 0.2 | 0.9 | 0.7 | 0.4 | 0.0 | -0.4 | -1.1 |
| Visit to a health center | 28.9 | 30.5 | 1.6 | 31.6 | 25.9 | -5.7* | -7.3 |
| Home visit | 8.0 | 11.4 | 3.4 | 24.5 | 10.8 | -13.7*** | -17.1*** |
| Newspapers/magazines | 0.0 | 0.2 | 0.2 | 0.0 | 0.0 | 0.0 | -0.2 |
| TV | 0.3 | 0.0 | -0.3 | 0.6 | 0.2 | -0.5 | -0.1 |
| Radio | 39.3 | 34.3 | -4.9 | 48.8 | 40.1 | -8.7** | -3.8 |
| Video | 0.8 | 1.5 | 0.7 | 1.4 | 30.2 | 28.8*** | 28.1*** |
| Other source | 4.5 | 2.4 | -2.1 | 1.1 | 0.9 | -0.2 | 1.9 |
Note: *** p < 0.01; ** p < 0.05; * p < 0.1
Source: 2016–2017 JSI-ISSP SPRING Survey, Burkina Faso.
Women’s Exposure to Hygiene Messages
The results related to the exposure of survey respondents to hygiene messages are similar to those related to the feeding messages presented above. Before the start of the intervention, the vast majority of women surveyed had also been exposed to hygiene messages (82.7 percent in the control area and 86 percent in the intervention area) (Table 7). This high level of exposure was, as with feeding messages, an important background in terms of hygiene knowledge. In terms of information sources, the exposure to video screenings at baseline was very low (2.5 percent in the area of intervention and 0.5 percent in the control zone), which was also expected. Community meetings, which were more commonly reported in the area of intervention (72.9 percent) than in the control area (67.8 percent), ranked first as a source of information, followed by radio (38.1 percent in the treatment area, compared to 40.4 percent in the control area), visit to a health center (24.1 percent in the treatment area, compared to 23 percent in the control area) and home visit by a community member (12.3 percent in the treatment area, compared to 10.1 percent in the control area). The existence of these competing channels of information is also likely to have diluted the impact of video screenings on hygiene behavior.
After completion of the intervention, women’s overall level of exposure to hygiene messages reached 95.3 percent in the intervention area and 93 percent in the control zone.5 However, as with the feeding messages, the information channels that contributed to this increase differ from one area to another. The weight of video projections reached 28.5 percent in the area of intervention (compared to an initial level of 2.4 percent), whereas it remained very low in the control zone (1.4 percent, compared to an initial level of 0.5 percent). This finding also shows that using video screenings to convey hygiene messages functioned relatively well, resulting in a net effect of 25.2 percent in favor of the intervention area between the two phases of the survey (Table 7). However, despite this increase, video projections were not the primary source of hygiene information in the area of intervention; they ranked third, after community meetings and radio.
The community meetings also increased in both areas and remained higher in the area of intervention (85.1 percent) than in the control area (73. 6 percent). However, the weight of a visit to a health center (whose difference between the two areas was not significant before the start of the intervention) became significantly higher in the control area (25.9 percent) than in the area of intervention (20.1 percent). The same applies to radio, for which the weight was 48.5 percent in the control area, compared to 37.8 percent in the intervention zone. The most striking case here is also with home visit from a community member, the weight of which remained almost stable in the intervention zone (11.3 percent, compared to an initial level of 12.3 percent) while rising from 10.1 percent to 24.4 percent in the control area, a net increase of 15.3 percent in favor of the control zone, between the two survey phases. As with exposure to feeding messages, this increase could be explained by the fact that the knowledge conveyed in video screenings related to the hygiene messages was also in part disseminated by other channels, including radio and community member visits.
Table 7: Exposure of Women Surveyed to Hygiene Messages
| Exposure | Percentage | ||||||
|---|---|---|---|---|---|---|---|
| Baseline | Endline | Effect (Diff-in-Diff) | |||||
| Control | Treated | Diff (T-C) | Control | Treated | Diff (T-C) | ||
| Source of exposure to hygiene messages | |||||||
| Exposure to hygiene messages | 82.7 | 86.0 | 3.4 | 91.9 | 96.0 | 4.1** | 0.7 |
| Displays in the community | 0.3 | 0.8 | 0.5 | 0.6 | 0.3 | -0.2 | -0.7 |
| Community meetings | 67.8 | 72.9 | 5.1 | 73.6 | 85.1 | 11.4*** | 6.3 |
| Public services of government | 2.5 | 1.4 | -1.1 | 0.6 | 0.4 | -0.1 | 1.0 |
| Visit to a health center | 23.0 | 24.1 | 1.1 | 25.9 | 20.1 | -5.8* | -6.9 |
| Home visit | 10.1 | 12.3 | 2.2 | 24.4 | 11.3 | -13.1*** | -15.3*** |
| Newpapers/magazines | 0.0 | 0.2 | 0.0 | 0.0 | 0.0 | -0.2 | 0.0 |
| TV | 0.4 | 0.0 | -0.4 | 0.9 | 0.0 | -0.9 | -0.5 |
| Radio | 40.4 | 38.1 | -2.3 | 48.5 | 37.8 | -10.6*** | -8.4 |
| Video | 0.5 | 2.4 | 1.9** | 1.4 | 28.5 | 27.0*** | 25.2*** |
| Other source | 4.0 | 2.9 | -1.2 | 0.3 | 1.1 | 0.8 | 1.9 |
Note: *** p < 0.01; ** p < 0.05; * p < 0.1
Source: 2016–2017 JSI-ISSP SPRING Survey, Burkina Faso.
3.4. Impact of the Intervention
The intervention’s impact on women’s feeding and hygiene behaviors was analyzed in two ways. The first analysis excluded the two villages that were originally to be covered by the intervention but ultimately was not. This estimate encompassed 48 villages, including 23 intervention villages (483 women of childbearing age) and 25 control villages (525 women of childbearing age), and was justified by the need to limit the phenomenon of diffusion between villages of the same commune. The exclusion of these two villages does not affect the validity of the estimated indicators, since the number of WRA subjected to analysis exceeds the minimum number of 383 women required per zone according to the sampling. Because data were collected from the two excluded villages in question, the second analysis included them as control villages in order to maximize the overall sample size. Therefore, this second estimate included 50 villages: 23 villages for the intervention zone and 27 villages for the control zone. However, the results of the two analyses are similar; therefore, only the results of the first analysis (excluding the two villages) are presented here. Results of the second analysis can be found in Appendix 1.
Effect of Video 1: Dietary Diversity and Resilience
Video 1 conveyed messages on dietary diversity and resilience. Two indicators were used to assess its effect on women’s nutrition behaviors: the dietary diversity score among pregnant women and the minimum dietary diversity of children aged 6–23 months. The dietary diversity scores are calculated by summing the number of food groups consumed by a woman over the last 24 hours prior to the interviewer’s home visit, out of a list of 17 possible food groups.6
The minimum dietary diversity among children is the proportion of children 6–23 months of age who received foods from four or more food groups (disaggregated by breastfeeding status). This indicator is estimated by the proportion of children aged 6–23 months who consumed at least four food groups per month. According to WHO recommendations, the seven food groups used for the calculation of this indicator are (1) grains, roots, and tubers; (2) legumes and nuts; (3) dairy products (milk, yogurt, cheese); (4) flesh foods (meat, fish, poultry, liver/organ meats); (5) eggs; (6) vitamin–A rich fruits and vegetables; and (7) other fruits and vegetables.
Table 8 shows that dietary diversity for pregnant women is almost identical and relatively low in both areas. Before the start of the intervention, about seven of 17 food groups were consumed by the pregnant women in each area. On completion of the intervention, there was no difference between the intervention zone and the control zone, since the score improved only by 1.5 points in each. Food diversity among children aged 6–23-months is also low, as the proportion of children consuming at least four food groups was only 3 percent in the treatment area, compared to 2.3 percent in the control area before the intervention. After completion of the intervention, this minimum dietary diversity increased significantly in both zones, but overall remained at a low level (5 percent). This could be explained by the high level of poverty in the East region, which is a barrier to women acquiring diverse foods for them when they are pregnant or for their young children, even if they know the value of the message conveyed by video 1. The increase in the dietary diversity score of pregnant women and the minimum dietary diversity among children in the control area could be explained by the existence of other channels of sensitization (highlighted in Table 6) and the possibility of dissemination of the message received via video 1.
Effect of Video 2: Importance of Exclusive Breastfeeding
Video 2 conveyed messages on the importance of exclusive breastfeeding. According to global recommendations, all children should be exclusively fed from birth to the age of six months. Breastfeeding provides essential nutrients and healthy antibodies, and early introduction of complementary foods and other liquids is not recommended, as it exposes children to pathogens and increases their risk of contracting diseases, especially diarrhea.
The effect of video 2 was evaluated using a single indicator: the proportion of infants aged 0–5 months fed exclusively with breastmilk. This proportion was obtained by relating the number of infants aged 0–5 months who received only breastmilk during the previous day to the total number of children aged 0–5 months. Before the intervention, the proportion of children 0-5 months fed exclusively with breastmilk was 66.2 percent in the treatment area and 62.9 percent in the control area, which appears to be particularly high.7 This high level of exclusive breastfeeding practice could be explained by the fact that the women surveyed were already involved in the activities of two development programs in their municipality. After implementation of the intervention, the practice of exclusive breastfeeding was estimated at 50.5 percent in the treatment area, compared to 54 percent in the control zone. This evolution shows a global narrowing of 6.8 percent in favor of the control zone, but this is not statistically significant. Therefore, video 2 did not have a statistically significant impact on the practice of exclusive breastfeeding during the assessment period.
Effect of Video 3: Age-Appropriate Complementary Feeding for Children Aged 6–23 Months
Video 3 conveyed messages on age-appropriate complementary feeding for children aged 6–23 months. Four indicators were defined to measure the impact of this video on women’s child nutrition behaviors. These were (1) minimum meal frequency—that is, the proportion of breastfed and nonbreastfed children aged 6–23 months who received solid, semi-solid, or soft foods (but also including milk feeds for non-breastfed children); (2) proportion of children 6–23 months of age receiving the minimum acceptable diet; (3) milk feeding frequency for non-breastfed children—that is, the proportion of non-breastfed children 6–23 months of age who received at least two milk feedings in the previous 24 hours8; and (4) the proportion of children aged 6–8 months consuming solid, semisolid, or soft foods.
Table 8: Estimated Effects of Video Projections on the Evaluation Outcomes by Controlling for Co-variates (48 Villages)
| Outcomes | Mean or Percentage | ||||||
|---|---|---|---|---|---|---|---|
| Baseline | Endline | Effect (Diff-in-Diff) | |||||
| Control | Treated | Diff (T-C) | Control | Treated | Diff (T-C) | ||
| Video 1: Dietary diversity and resilience | |||||||
| Video 2: Importance of exclusive breastfeeding | |||||||
| Video 3: Age appropriate complementary feeding for babies 6 23 months | |||||||
| Video 4: Importance of handwashing with soap | |||||||
| Dietary diversity score among pregnant women | 7.4 | 7.1 | -0.3 | 8.9 | 8.6 | -0.3 | 0.0 |
| Minimum dietary diversity among children | 2.3 | 3.0 | 0.7 | 4.9 | 5.0 | 0.1 | -0.6 |
| Exclusive breastfeeding under 6 months | 62.9 | 66.2 | 3.3 | 54.0 | 50.5 | -3.5 | -6.8 |
| Minimum meal frequency | 64.8 | 65.1 | 0.2 | 70.0 | 63.8 | -6.2 | -6.4 |
| Minimum acceptable diet | 3.2 | 2.2 | -1.0 | 6.1 | 4.0 | -2.0 | -1.0 |
| Milk feeding frequency for non-breastfed children | — | — | — | — | — | — | — |
| Percentage of women with a child between 6–8 months introducing complementary feeding | 95.9 | 93.8 | -2.1 | 97.0 | 86.2 | -10.8 | -8.8 |
| Percentage of households with at least one place designated to wash hands | 3.3 | 4.0 | 0.7 | 17.8 | 24.3 | 6.5* | 5.8 |
| Percentage of households with handwashing station that has soap and water | 2.9 | 4.0 | 1.1 | 16.5 | 23.6 | 7.0** | 5.9 |
| Percentage of women who know critical times to wash hands | 1.0 | 10.2 | 9.2*** | 18.2 | 29.5 | 11.3*** | 2.1 |
| Percentage of women who know how to demonstrate proper handwashing behavior | 51.5 | 56.1 | 4.6 | 50.5 | 67.7 | 17.3*** | 12.7 |
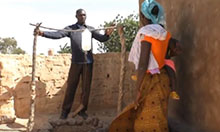
| Percentage of women who cite that husband is responsible for maintaining handwashing station | 19.2 | 20.8 | 1.5 | 23.7 | 22.0 | -1.7 | -3.3 |
Note: *** p < 0.01; ** p < 0.05; * p < 0.1
Source: 2016–2017 JSI-ISSP SPRING Survey, Burkina Faso
The results shown in Table 8 indicate that there is no statistically significant difference between the two areas before and after the intervention, suggesting that video 3 also had a mixed impact on child nutrition behaviors. Indeed, the minimum frequency of meals for children aged 6–23 months and the introduction of complementary feeding for children aged 6–8 months were relatively high in the baseline survey and showed a slight improvement in the control area while remaining relatively stable in the area of intervention. As already mentioned, this situation could be explained by the other channels of child nutrition promotion, which were more prevalent in the control area than in the intervention zone during the evaluation period (see Table 6). In addition, despite the relatively high prevalence of minimum meal frequency, the proportion of children aged 6–23 months who had an acceptable diet remained very low in both areas, although there was a slight improvement in the control area (6.1 percent, compared to initial level of 2.2 percent). This is due in particular to the low dietary diversity among children noted above.
Effect of Video 4: Importance of Handwashing with Soap
Video 4 conveyed messages on the importance of handwashing with soap. To assess the effect of this video on hygiene behavior, five indicators were defined. These were (1) percentage of households with at least one place designated to wash hands; (2) percentage of households with handwashing station that has soap and water; (3) percentage of women who know critical times to wash hands; (4) percentage of women who know how to demonstrate proper handwashing behavior; and (5) percentage of women who cite that their husband is responsible for maintaining handwashing station.
Except for the percentage of women who said that their husband is responsible for maintaining the handwashing station, which remained stable, the four other indicators showed a significant improvement, particularly in the intervention area (Table 8). For example, compared to the control area, the percentage of households with at least one place designated to wash hands and the percentage of households with a handwashing station with soap and water experienced a net increase of 6 percent in the area of intervention, and this increase is marginally significant. The same applies to the percentage of women who know how to demonstrate proper handwashing behavior, which increased by 13 percent in the intervention area between the two survey phases. The second phase took place several months after the videos were shown to women in the area covered by the intervention, so it appears that the effect of video 5 on these indicators was maintained over time. Indeed, compared to the previous videos, the messages conveyed by video 5 relate more to concrete physical structure and actions that can be implemented even in a context of widespread poverty. In addition, with images, a population of women who are overwhelmingly non-literate will generally be better able to assimilate the technical handwashing gestures compared to other sources of handwashing promotion such as community meetings, and especially the visit (health center, home) and the radio, which are much more present in the control area. The stability of the percentage of women who mentioned that their husband is responsible for maintaining the handwashing station in the two phases of the survey is probably explained by the persistence of gender inequalities attributable to gender-specific roles. Maintaining household cleanliness is usually attributed to the woman, and even where the husband does a specfic chore such as maintaining the handwshing station, some women will claim this role publicly.
Conclusion
This study used a quasi-experimental approach to test the capacity of video screenings to change behavior related to nutrition and hygiene in 50 villages in Burkina Faso’s East region. The villages were selected by reasoned choice in the communes of Manni (20 villages) and Gayéri (30 villages) from the platform of two partner projects already carrying out development activities in these two communes: REGIS-ER, which covers the municipality of Manni, and the Faso project, which covers the municipality of Gayéri. As for the women surveyed, they were randomly selected from the lists of women of childbearing age that were previously prepared by the two programs in the 50 selected villages.
The comparison of the area of intervention with the control area showed some significant differences between the two zones before the project started. Women residing in the control area are relatively younger, more educated, more monogamous, have fewer children, listen more often to the radio, and watch television more frequently than those residing in the project area. To minimize the biases associated with these differences, the concerned variables were introduced in the difference-indifference models to estimate the different outcomes.
With regard to the exposure of women to the intervention, the analysis clearly showed that the proportion of women recieving messages on nutrition and hygiene through video projections increased considerably in the area of intervention between the two phases of the investigation. However, there were other sources of nutrition and hygiene information in both areas, including community meetings and radio, which had greater population coverage compared to the video screenings. These competing channels of information may have diluted the impact of video projections on nutrition and hygiene behaviors, especially as they were more present in the control area (radio, home and health center visits). For example, knowledge shared via video screenings in the area of intervention could in part be disseminated in the control area through these competing information channels. In both the intervention and control areas, the women surveyed already had a high level of nutrition and hygiene knowledge prior to the intervention (more than three-quarters of women had already received messages about feeding and more than four-fifths had already received messages about handwashing).
In terms of impact, the intervention had a mixed effect on changes of women’s and children’s nutrition behaviors. Although most nutrition behaviors improved between the two phases of the survey, these behaviors improved in both intervention and control areas, and no statistically significant difference was observed between the two areas. The trend was contrary, however, in terms of hygiene behaviors, which showed a significant improvement, particularly in the area of intervention. Several reasons can be given for the mixed nature of these results.
First, video screenings were not accompanied by a specific feeding grant for women who watched the videos, even though they received home visits to encourage them to adopt the good nutritional behaviors modeled in the videos. The effective application of some of the feeding messages conveyed requires financial means to acquire the necessary and recommended foods for adequate nutrition for pregnant women and young children. Therefore, even if women have assimilated the messages conveyed, widespread poverty in the East region may effectively limit message uptake. Second, the existence of competing information channels in both zones (with a greater preponderance in the control zone) could have diluted the scope of the intervention’s effect. As already mentioned, before the intervention, women already had a high level of feeding and hygiene knowledge, which was mainly provided via community meetings and radio. On completion of the project, this pattern was not reversed, as video projection did not become the dominant information channel; rather, it ranked third, behind community meetings and radio, in the intervention area. It may then be that the exposure of women from the area of intervention to the video screenings did not reach the minimum threshold at which a visible change in the adoption of the behaviors conveyed in the videos could be observed. Another possible dynamic could be that community video supplemented the effect of these other channels of communication only with regard to hygiene behaviors because the videos were able to show these practices in a tangible way; or perhaps hygiene messages were not a focus of information being communicated through other channels.
That the effect of the intervention on hygiene behavior was more pronounced and visible than its effect on nutrition may be explained by the fact that the hygiene message conveyed is, for the most part, a set of more concrete technical actions, able to be implemented even in a context of widespread poverty. In addition, with images, women who are mostly non-literate will generally be better able to assimilate the technical handwashing gestures, compared to other sources of handwashing promotion such as radio and community meetings, which have a much greater presence in the control area. Finally, among the four videos, the handwashing video was shown late in the course of the intervention, which might explain why the results are stronger.
To view the annex, or view in French, please download the full report above.
Footnotes
1 New interviewers replaced a few interviewers from the first phase who were not available during the second phase.
2 This difference with the initial distribution of the sample (525 women of child-bearing age per zone) is explained by the fact that two villages that were to be covered by the intervention were ultimately not covered.
3 Of the two women, one was seriously ill and could not answer the interviewer's questions. The other woman was in mourning because her husband was deceased, and it was forbidden for her to speak to strangers at the time of the survey.
4 This strong increase in the level of exposure is partly related to the activities of the FASO and REGIS-ER projects. In the intervention area, the women's groups that were used to disseminate the videos are groups formed by these projects. Besides the video dissemination meetings held once a month, these groups also meet once more each month to participate in activities organized by REGIS-ER and the FASO project. The two projects are also present in the control area. In these villages, the activities are carried out by the promoters and the leading mothers through a minimum package that includes (1) screening for malnutrition and referral to health centers; (2) cooking demonstrations; (3) monthly animations on selected themes in connection with IYCF; (4) advice on nutrition, hygiene, diarrheal diseases, or malaria; and (5) home visits.
5 As mentioned earlier, in the discussion of women’s exposure to feeding messages, the strong exposure to hygiene messages is also related in part to activities of the Faso and REGIS-ER projects.
6 These include (1) cereals (wheat, maize, rice, sorghum, millet, or other cereals) or foods made from cereals (bread, noodles, porridge, tô, etc.); (2) white roots and tubers; (3) vegetables and tubers rich in vitamin A (pumpkin, carrot, pumpkin, sweet potato [orange or yellow fleshed], red pepper, etc.); (4) vegetables and dark green leaves, including wild forms and other local vegetables rich in vitamin A (amaranth, cassava leaf, kale, spinach, etc.); (5) other vegetables (tomato, onion, eggplant); (6) fruits rich in vitamin A (ripe mango, melon, watermelon, fresh or dried apricot, mature papaya, etc., and juices from these fruits); (7) other fruits, including wild fruits; (8) meat products (beef, pork, lamb, goat, rabbit, chicken, cana, etc.); (9) eggs; (10) fish and seafood (fresh or dried); (11) legumes, nuts, and seeds (dried beans, dry weight, lentils, nuts, seeds); (12) dairy products (milk, yogurt, cheese, or other dairy products); (13) oils and fats; (14) sweet foods (sugar, honey, soda, beverages, or sweetened juices); (15) spices and condiments; and (16) red palm products.
7 Although the DHS data are not comparable to those of the present study, the proportion of children aged 0–5 months fed exclusively breastmilk the previous day was estimated from the 2010 DHS as 39.6 percent for the East region and 24.8 percent nationally.
8 This indicator has not been estimated because of the widespread practice of breastfeeding. There were only 34 children aged 6–8 months who were not breastfed—that is, 9 in the baseline survey (6 in the control zone and 3 in the intervention zone) and 25 in the second phase of the survey (19 in the control area and 6 in the treatment area).
References
INSD and ICF International. 2012. Enquête démographique et de santé et à indicateurs multiples (EDSBFMICS IV), Burkina Faso 2010. Calverton, MD: Macro International.
World Health Organization, UNICEF, USAID, AED, UCDAVIS, and IFPRI. 2008. Indicators for Assessing Infant and Young Child Feeding Practices–Part 1 Definitions. Geneva: WHO.
World Health Organization, UNICEF, USAID, AED, UCDAVIS, and IFPRI. 2010. Indicators for Assessing Infant and Young Child Feeding Practices – Part II Measurement. Geneva: WHO.